

- Studio Vektor
- Insights
- Interactive report examples
Guide · Interactive reports
Interactive Reports: Examples, Features and Benefits
Research, benchmark and annual reports are the content most worth making interactive: readers want to find themselves in the data. Here are five real examples and the features that make them work.
What makes a report “interactive”
Not page-turn effects or a video on the cover. A report is interactive when the reader can change what they see: filter a chart to their segment, toggle between two measures, enter their own figure to compare it with the benchmark, or guess a finding before it is revealed. Everything else (structure, summaries, narration) makes the report easier to read; interaction makes it personal.
Five examples
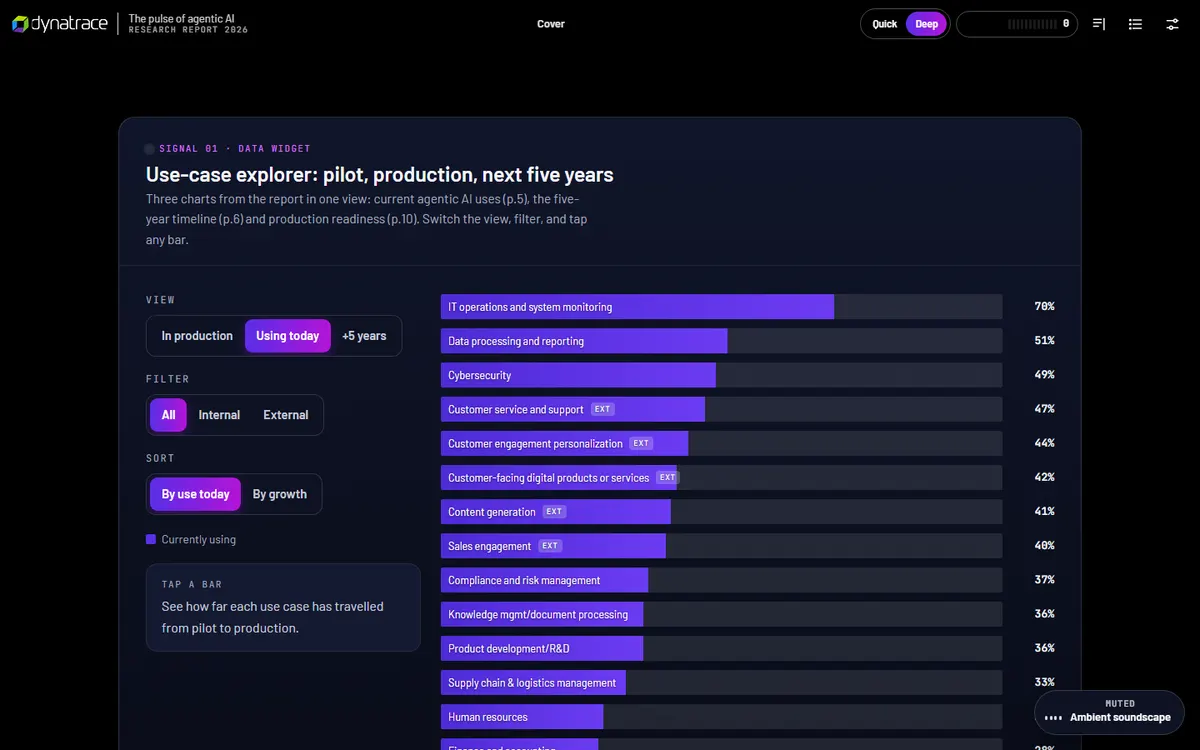
1. Dynatrace, The Pulse of Agentic AI
A 33-page survey report rebuilt with a use-case explorer, a budget benchmark the reader places themselves on, barrier and validation checklists, simulations and a quiz, with gists and editor’s notes added and clearly labelled. Read the case study.
2. Gong, 2026 State of Revenue AI
The interactive edition uses a different reading pattern in each chapter: toggle-filter charts, slider charts and a four-question micro-quiz with a recap, plus reading tracks and read-aloud.
3. Cvent × ON24, The State of AI in B2B Marketing in 2026
Research from 261 B2B marketers, rebuilt so readers can benchmark themselves against their peers, build a webinar campaign-in-a-box, audit their first-party data and finish with a nine-step self-check. Open the edition.
4. Figma, How design systems power the new pace of product development
The interactive edition of Figma’s report opens with a cover that generates itself from a design system, adds narration synced to the text and invites readers to collect 12 “context layers” across five chapters.
5. NiCE, Harnessing Digital Channels and WFM
Seven short chapters on contact-center service, each with something to try: staffing simulators (including a method-by-interval comparison), reveal cards and a checkpoint micro-quiz with instant feedback. Open the edition.
Features that matter most in reports
| Feature | What it does for the reader |
|---|---|
| Filterable and toggle charts | Shows the data for their segment, region or company size |
| Self-benchmarking | Places their own answer against the survey distribution |
| Predict-then-reveal | Makes surprising findings memorable by testing assumptions first |
| 30-second gists | Lets executives get each chapter’s point quickly |
| Read-aloud | Makes long reports usable on a commute or for readers who prefer audio |
| Checkpoint quizzes | Helps key findings stick and shows what was understood |
Benefits for publishers
- Findings get used, not just downloaded. Readers who interact with data remember it and repeat it.
- You see what resonates. Analytics show which charts are filtered, which sections are read and where readers stop.
- Each finding becomes shareable. Sections and statistics can be linked to directly, which a PDF page cannot.
- The report keeps working. One URL can be updated, extended with next year’s data and kept in search results.
Keeping it credible
Interactive reports must keep the research honest. Show the published figures exactly as published, label anything illustrative or editorial, keep methodology one click away, and never let an interaction imply a precision the data doesn’t have. The examples above label their additions; the Dynatrace edition, for instance, separates its editor’s notes and simulations from the report’s own text.
FAQ
Can an annual report be interactive?
Yes. Annual and impact reports suit the format well: key figures as explorable charts, a summary track for stakeholders and a full track for analysts. A PDF version can still be offered for filing.
Do we need the underlying data?
For explorable charts, yes: the figures behind each chart, usually from a spreadsheet. Fixed figures from the report are enough for summaries, quizzes and benchmarks.
How long does an interactive report take?
A focused report with interactive charts and an assessment typically takes about 1 week once content is final. Larger reports with many tools are scoped individually.
Publishing research this year? Plan the interactive edition alongside the PDF. Charts, benchmarks and quizzes from $1,170.