

- Studio Vektor
- Interactive eBooks
- Snowflake: A Practical Guide to AI Agents
Case study · Interactive eBook
A Practical Guide to AI Agents, rebuilt as an interactive edition
Snowflake’s guide explains what AI agents are, where they help and why the quality of their work depends on data. Studio Vektor turned the 21-page PDF into a reading experience where the ideas can be watched, tried and listened to.
- Publisher
- Snowflake
- Original format
- 21-page landscape PDF
- Edition
- 5 chapters, 16 readiness checks
- Status
- Independent portfolio demonstration
This is an interactive edition of a guide Snowflake published. The text and figures are Snowflake’s; the reading experience, interactions and build are Studio Vektor’s. It was not commissioned by, affiliated with or endorsed by Snowflake. Widget data marked “illustrative” inside the edition is a demonstration model, and community notes, reader counts and poll results are placeholders for a real community backend.
The starting point: a well-designed PDF
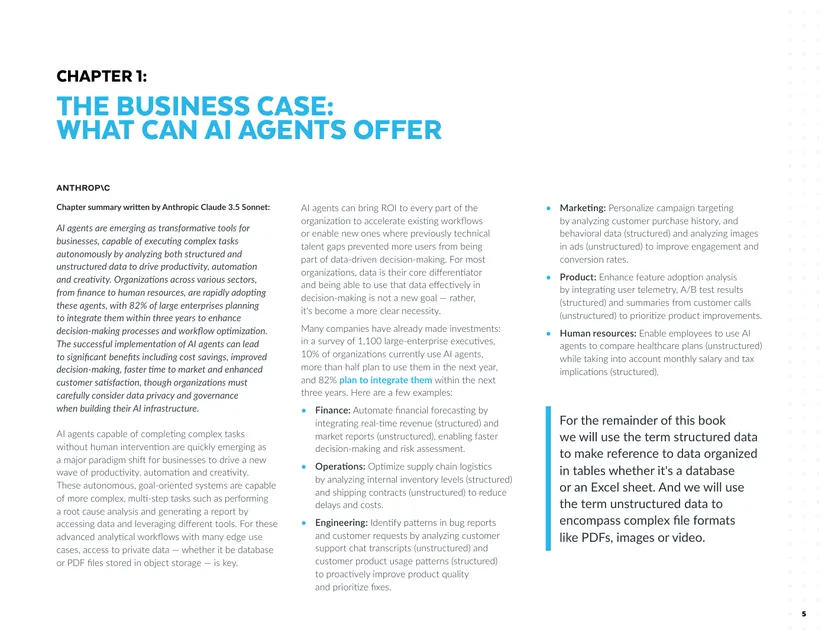
The original is a clean, 21-page landscape document: a cover, chapters on agent concepts, use cases by department and considerations for ROI. Like most PDFs, it asks the reader to do the work, scrolling through dense pages to picture an agent sensing, reasoning and acting on data. The concepts are dynamic; the format is not.
The brief
What the edition had to solve that the PDF could not. The guide’s argument is strong; the problem is that its most important ideas are processes, and a page can only describe a process.
Make an agent visible
“An agent senses, reasons, plans, coordinates, acts and learns” is easy to read and hard to picture. Readers needed to see one work through a real question, step by step.
Show why data decides quality
The guide’s central claim is that agents are only as good as the structured and unstructured data they can reach. That claim had to be something a reader could test, department by department.
Serve two very different readers
An executive wants the shape of the argument before a meeting; an architect wants the whole thing. One document had to work as a five-minute brief and as a full read.
Who it is for
Data, IT and business leaders deciding where AI agents fit. They are busy, skeptical of hype and want to see how an agent actually uses their data.
Quick readers
Executives who want the five key ideas in a few minutes. The Quick track keeps every chart and tool and folds the detail away.
Deep readers
Architects and analysts who want the full argument. The Deep-dive track is about 32 minutes of reading with every note open.
Listeners
People who would rather hear it. Read-along narration highlights the text as it plays; tap any word to jump there.
From PDF to edition, chapter by chapter
The edition follows the guide’s own order, so nothing Snowflake wrote is lost or rearranged. Each chapter gains one or two interactions where the page used to ask the reader to imagine something.
| Chapter | In the PDF | In the interactive edition |
|---|---|---|
| Cover and introduction | Title page and a written definition of AI agents | A live agent panel works through a churn question on the cover; the introduction can be read aloud with word tracking; readers choose a Quick or Deep-dive track |
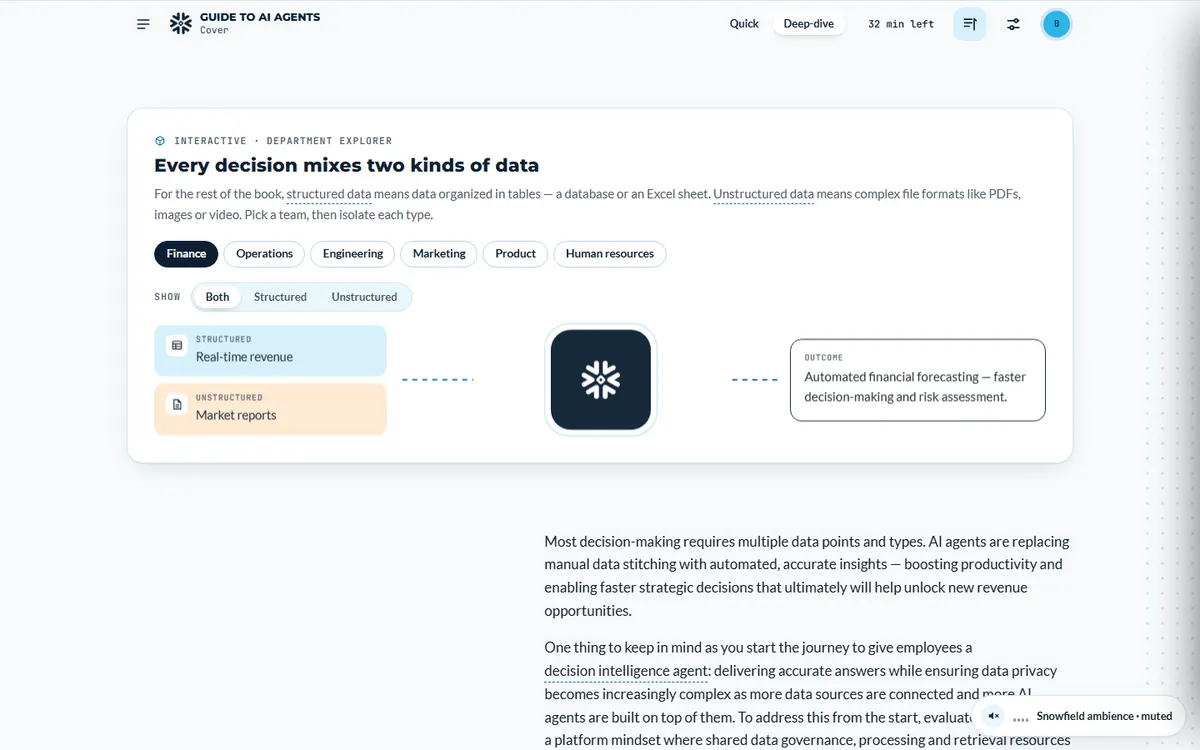
| 1 · The business case | Adoption figures, a chart of leader expectations, five benefits | An adoption waffle chart, a department explorer that filters by structured and unstructured data, survey bars and a five-benefit accordion |
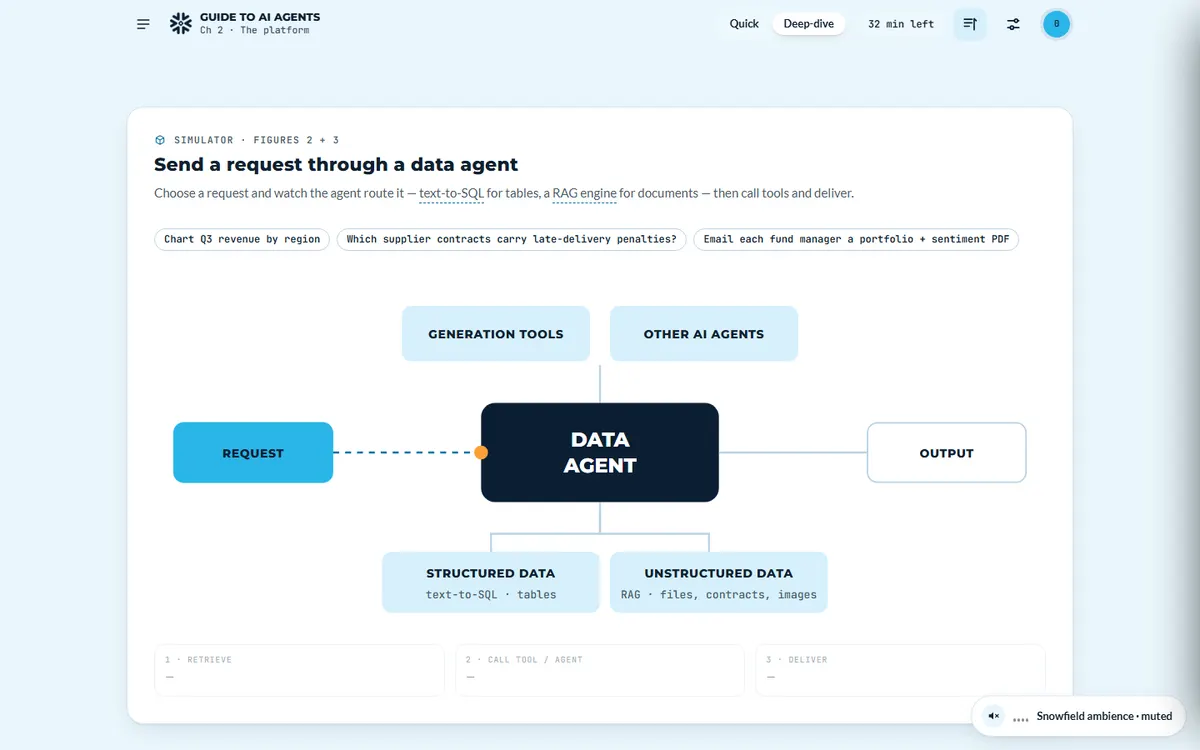
| 2 · The platform | Figures 1–3: the evolution from LLMs to agents, the agent loop, how a data agent works | A timeline, an animated agent loop and a simulator that sends a chosen request through a data agent, showing the text-to-SQL or retrieval step it takes; an access-scope trade-off to find the efficiency sweet spot |
| 3 · Ethics and bias | Challenges of integration, governance, guardrails and handoffs | Tabs for guardrails, evaluation and observability; a handoff-threshold widget (“when should the agent pass it to a person?”); an “ask the agent to show its work” explainer |
| 4 · Rolling out agents | A strategic roadmap and principles | The roadmap as a sequence, plus a reader poll: which principle is hardest to get right? |
| 5 · Snowflake for data agents | Figure 4: the AI applications framework | A framework explorer: select a layer to see its detail |
| Lock it in · Agents at work | Industry examples and an Accenture case | A six-question checkpoint with instant feedback and a recap deck, an industry finder with filters, and the Accenture case as an expandable story |
What Studio Vektor did
Content architecture, interaction design, visual design and front-end development, from the PDF to a single responsive web edition.
Restructured the content for the screen
Split the guide into five chapters with clear entry points, added short summaries and set up two reading tracks so the same edition works for a five-minute skim or a full read. Reading time is shown per chapter, per track and as minutes left.
Turned explanations into interactions
Wherever the PDF described a process, the edition shows it: an agent working through a request on the cover, a simulator that routes a request through a data agent, and an explorer of structured and unstructured data by department.
Designed in the publisher’s visual language
Snowflake’s blue palette, outlined display type and network motifs carry through, so the edition feels like the brand rather than a template.
Built for reading, not just for show
Responsive layout, keyboard-friendly controls, adjustable reading settings and an ambient soundscape that stays muted until the reader turns it on.
Interactive features
Sixteen readiness checks across five chapters, tracked in a progress ring. These are the interactions that do the most explaining.
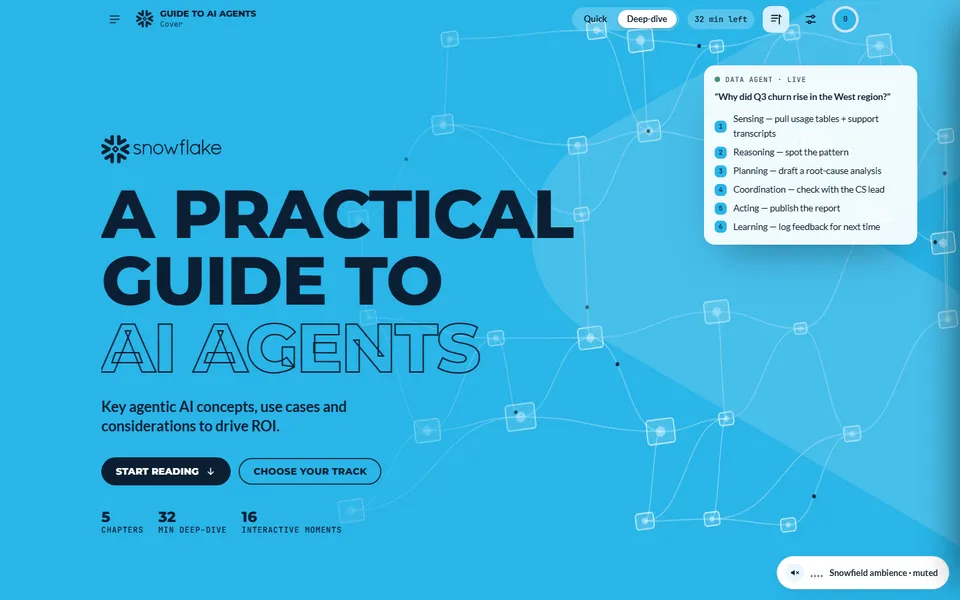
Live agent panel on the cover
Before a single paragraph, the reader watches an agent handle a customer-churn question through six stages: sensing, reasoning, planning, coordination, acting and learning. The rest of the guide explains what they just saw.
Handoff threshold
A widget asks when an agent should pass a task to a person. It turns an abstract governance principle into a decision the reader has to make, which is exactly the decision their team will face.
Footnote popovers
Dashed terms such as text-to-SQL, RAG engine, algorithmic bias, guardrails and red-teaming open a definition in place, so a non-specialist can keep reading without leaving the page.
Checkpoint and result
A six-question “Lock it in” checkpoint gives instant feedback and a recap deck. Completed checks fill the progress ring and unlock badges and a result tier at the end.
Reading experience and accessibility
A long technical guide only works if people can read it comfortably on any device, in any way they prefer.
Two tracks, one edition
A switch in the header moves between Quick and Deep-dive at any time; reading times recalculate and the reader keeps their place.
Listen along
Read-aloud with word or sentence highlighting, speed control and tap-to-jump, with an optional device voice.
Reading settings
Text size, Auto, Light, Sepia and Dark themes, a dyslexia-friendly typeface (Atkinson Hyperlegible), bionic emphasis and a calm-motion switch.
Real text, real headings
Every word is HTML text with ordered headings, not an image of a page, so it can be searched, translated, selected and read by assistive technology.
Announced results
Fifteen live regions announce widget results and quiz feedback to screen-reader users as they change.
Motion and sound on the reader’s terms
Animations respect the system’s reduced-motion setting, and the ambient soundscape never plays until the reader turns it on.
Design system
The palette is taken from Snowflake’s brand and tested for contrast in the reading context. Each color has one job.
- Snowflake blue
#29B5E8Panels and graphics; midnight text on it at 7.0:1 - Blue ink
#0A6FA6Headings and links on paper, 5.2:1 - Midnight
#0B1F33Buttons, quiz and player - Mid-blue
#11567FDepth and data accents - Valencia orange
#FF9F36Highlights and unstructured data - Ink
#10202FBody text on paper, 15.8:1
Type
Montserrat 800 in uppercase for display, Lato for body text, JetBrains Mono for labels, and Atkinson Hyperlegible for the dyslexia-friendly mode. Fonts fall back to system stacks offline.
Color carries meaning
Orange always marks unstructured data and moving packets; blue marks structured data and the platform. A reader learns the code once and can read every diagram.
Interactions earn their place
Each widget replaces a paragraph that was hard to picture. Nothing is animated just to move.
How it’s built
A guide like this should be as easy to host and maintain as the PDF it replaces.
| Aspect | Approach |
|---|---|
| Delivery | One self-contained HTML file (about 1.1 MB) with every image embedded. No reader app, plugin, platform or subscription. |
| External requests | Only the web fonts, which fall back to system fonts if they can’t load |
| Graphics | Around 80 inline SVG graphics and three canvas elements, drawn in the page so they stay sharp at any size |
| Audio | The ambient soundscape is generated in the browser with the Web Audio API; narration can use the device’s own voice through the Web Speech API |
| State | Reading progress and settings are saved in the reader’s browser; nothing is sent to a server |
| A print stylesheet produces a clean paper version from the same file | |
| Content length | Roughly 4,900 words of reading text, all selectable and searchable |
PDF vs interactive edition
The PDF still has a job. It is the right format to attach, archive or print. The edition is the right format to read, share and learn from.
| Question | Original PDF | Interactive edition |
|---|---|---|
| How is a process explained? | Static figures and description | The reader runs the process: simulator, agent loop, animated panel |
| Does it fit a five-minute read? | One length for everyone | Quick and Deep-dive tracks with reading times |
| Can the reader test the argument? | No | Department explorer, trade-off and handoff widgets |
| Can it be listened to? | Only with separate software | Built-in read-along narration |
| Does it work on a phone? | Landscape pages need zooming | Responsive layout |
| Can the publisher see what’s read? | A download count at best | Every track choice, interaction and completion can be an analytics event |
| Can it be attached to an email? | Yes | Shared as a link (or packaged as a single file) |
What we would measure
This edition is an independent demonstration, so it has no audience data and we don’t claim results for it. For a publisher, the same build would be instrumented from day one.
Depth of reading
Which track readers choose, which chapters they finish and where they stop. That shows whether the guide is read or just opened.
Engagement with the argument
Which simulator requests are run, which departments are explored and where readers set the handoff threshold. That is direct evidence of what the audience cares about.
Intent
Checkpoint scores, poll answers and clicks to a demo or contact form, connected to the publisher’s marketing automation if needed (quoted separately).
Where this approach fits
The pattern here, showing a process rather than describing it, works for any guide whose core idea moves.
Technical explainers
Architecture guides, platform overviews and “how it works” papers where a simulator does more than a diagram.
Thought-leadership guides
Long-form content for two audiences at once, where reading tracks let one asset serve executives and practitioners.
Enablement material
Guides used by sales and partner teams, where a checkpoint confirms the key ideas landed.
FAQ
Common questions about this edition and projects like it.
Was this edition commissioned by Snowflake?
No. It is an independent portfolio demonstration built from a guide Snowflake published. The text and figures are Snowflake’s; the interactions, design and build are Studio Vektor’s.
Does an interactive edition replace the PDF?
Usually not. Most publishers keep the PDF for downloads and print and make the interactive edition the version they promote and share. Both can come from the same content.
What would an edition like this cost?
Interactive eBooks start from $635, and the Advanced package with one defined quiz or scoring tool starts from $1,170. An edition at this depth, with several simulations, narration and two reading tracks, goes beyond those packages and is quoted on scope after we see your document.
Can it be hosted on our own website?
Yes. The edition is a single HTML file that can be hosted on any website or content platform, placed behind a form, or linked from email and social posts.
Have a guide like this?
Turn your PDF into something people explore.
Send the document and tell us who reads it. You’ll get a recommendation of the interactions worth adding, a fixed price and a timeline.