

- Studio Vektor
- Interactive eBooks
- Dynatrace: The Pulse of Agentic AI
Case study · Interactive report
The Pulse of Agentic AI, from research report to interactive report
Research reports are full of charts the reader can only look at. The interactive edition of Dynatrace’s 2026 report lets readers filter, sort and place themselves in the data, with word-tracked narration, simulations and a quiz alongside the published findings.

- Publisher
- Dynatrace
- Original format
- 33-page landscape PDF report
- Edition
- 5 chapters, 12 signals to collect
- Status
- Independent portfolio demonstration
An interactive edition of a research report Dynatrace published. Text and figures are as published; the gists, editor’s notes, deep dives, glossary, simulations and quiz were written for this edition by Studio Vektor. Not commissioned by, affiliated with or endorsed by Dynatrace. Simulation parameters and loop timings are set for demonstration.

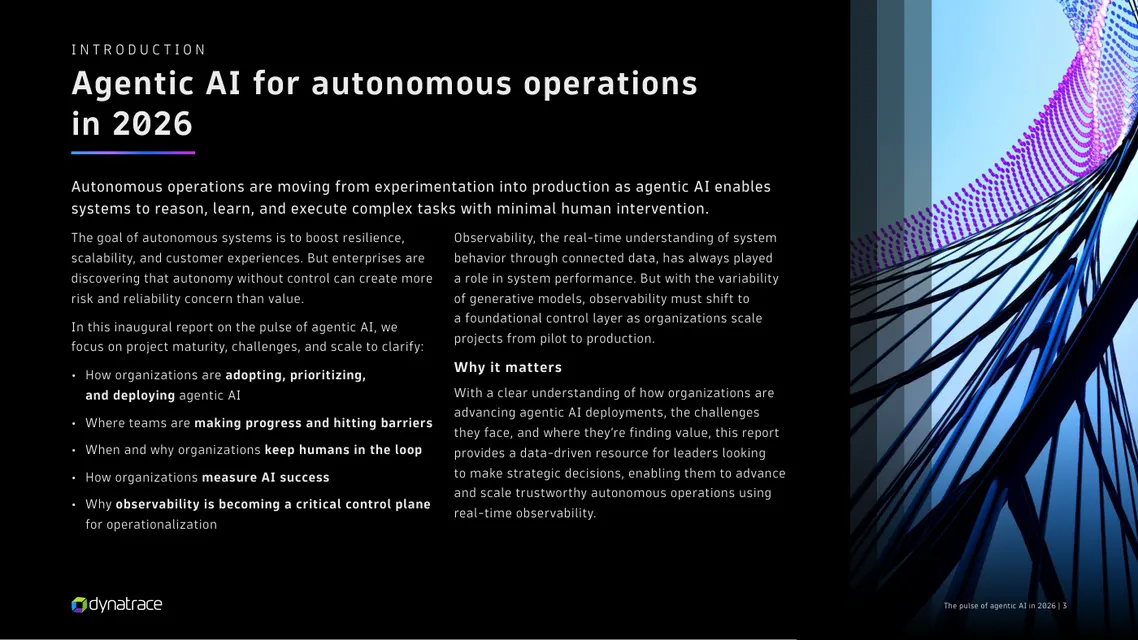
The starting point: a survey-based research report
The report draws on a survey of 919 senior leaders across 15 countries and tracks how far agentic AI projects have got, where they stall and why observability has to become the control layer. In PDF form, its findings are a sequence of fixed charts and stat callouts across 33 widescreen pages. Readers can’t ask the data a question, such as “what about companies like mine?”
The brief
A benchmark report has one question behind every chart: where do I stand? The edition had to answer it without changing a single published number.
Let readers place themselves
Turn distributions into benchmarks: the reader picks their own budget, project count or barriers and sees where they sit among the 919 respondents.
Explain the systems argument
The report argues that faults spread through connected agents and that observability must act as a control plane. Those are dynamics, and dynamics are clearer when you watch them.
Keep the research credible
Published findings stay exactly as published, with page references. Everything added for the edition is labelled as editorial.
Who it is for
Technology and operations leaders weighing autonomous operations: CIOs, heads of platform and SRE, and the people who sign off AI budgets.
Benchmarkers
Want to see where their organization sits against the survey. The budget and maturity widgets let them place themselves.
Skimmers
Read each section’s 30-second gist and the charts on the Quick track, then decide what to read in full.
Practitioners
Use the Deep track’s editor’s notes, glossary and checklists to take the findings into their own planning.
From PDF to edition, chapter by chapter
Every section of the edition shows its page range in the original report, and each data widget cites the page its figures come from.
| Chapter | The report’s finding | In the interactive edition |
|---|---|---|
| Introduction | Agentic AI for autonomous operations in 2026 | A 30-second gist, narration of the introduction with word tracking, and a choice of Quick or Deep-dive track |
| 1 · Beyond IT operations | Uses and budgets are rising, production readiness is growing | A use-case explorer combining three of the report’s charts; a budget benchmark |
| 2 · Progress and barriers | Adoption is maturing; observability concerns block production | A maturity self-locator, a barrier diagnostic with a visibility gauge and a 12-second loop of one incident across three phases of trust |
| 3 · Trust and automation | Human oversight is intentional and enduring | A “trust stack” of validation measures and a dial that shifts 15 functions from current to future automation |
| 4 · Reliability and resilience | Priorities and KPIs are converging; faults spread through connected agents | A priorities scorecard and a fault simulation across fourteen connected agents |
| 5 · Observability as a control plane | Observability is used across the lifecycle but leaves gaps | Lifecycle tabs and an animated control-plane stack that traces one request from infrastructure to business outcome |
| Appendix and close | Additional findings, global summary, methodology | A regional lens comparing the Americas, EMEA and APAC; the methodology; a five-question quiz and a reader profile to copy or print |
What Studio Vektor did
Kept the published findings intact and built a reading layer around them.
Made the data explorable
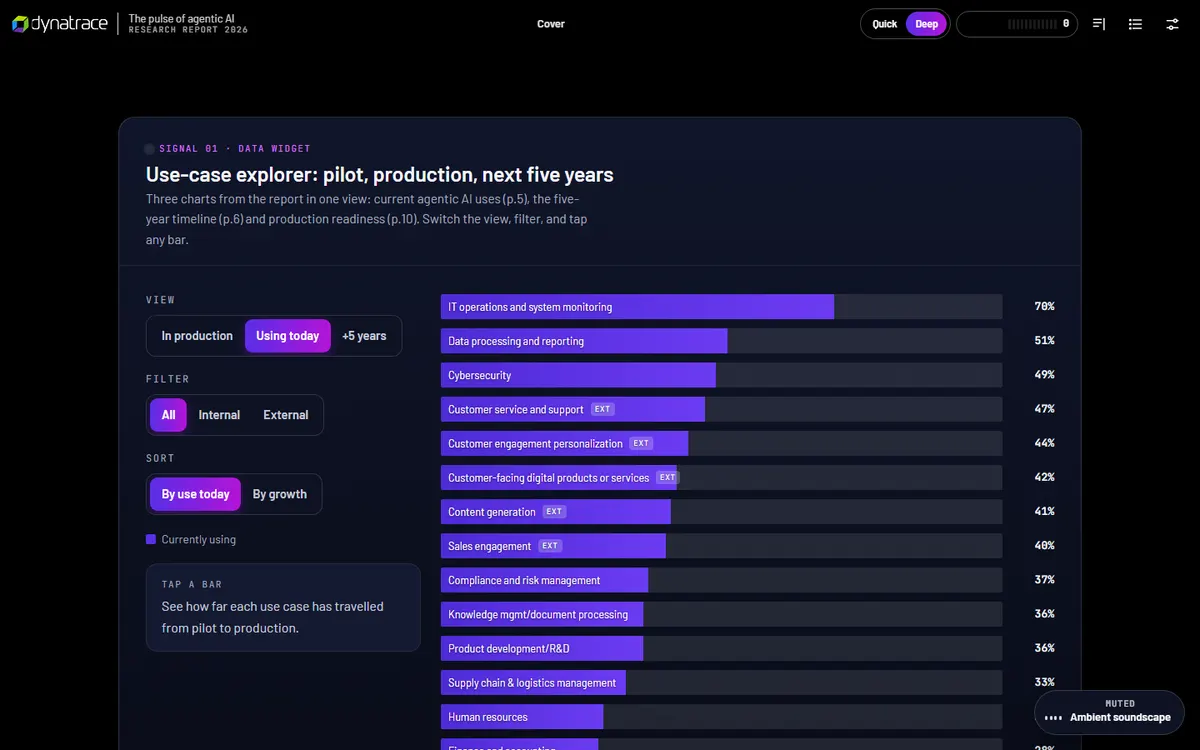
The use-case findings became an explorer with three views (in production, using today, in five years), filters for internal and external use and two sort orders.
Let readers place themselves
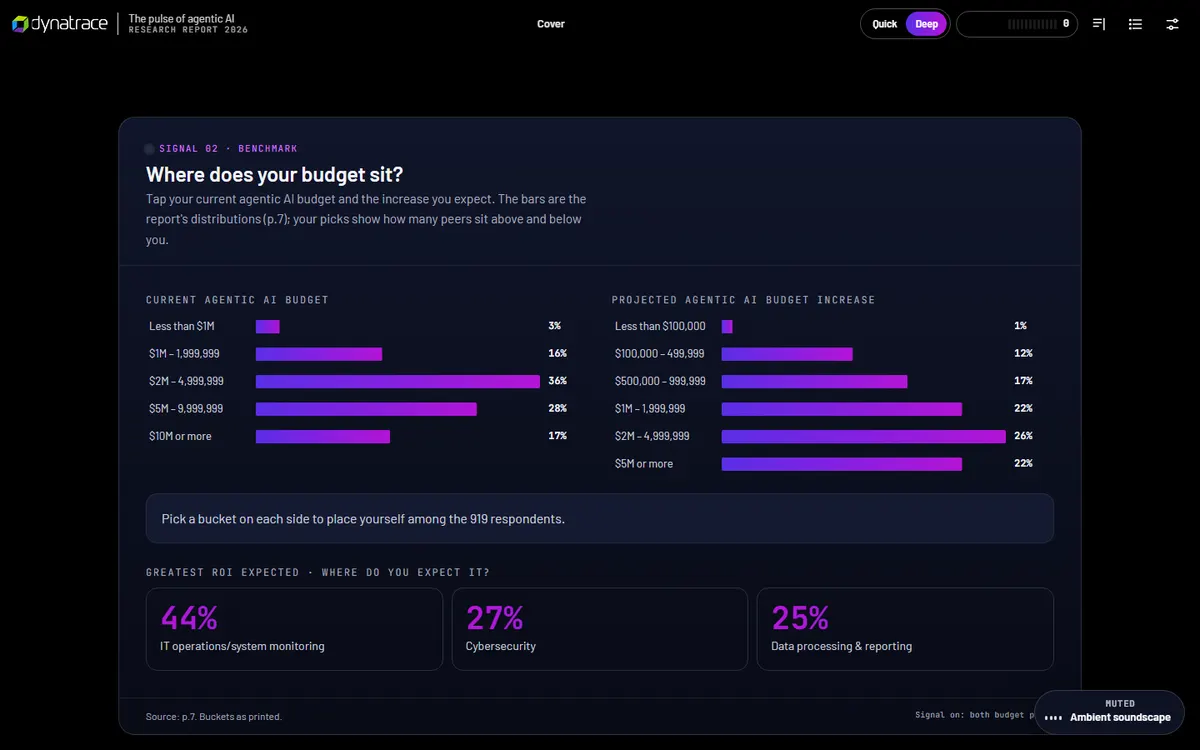
A budget widget asks where the reader’s agentic AI budget sits and shows the survey’s distribution beside their answer; a maturity ladder and barrier checklist do the same for adoption.
Added an editorial layer
Thirty-second gists, editor’s notes that tie the chapters together and a glossary, written for this edition and clearly separated from the published text.
Made it listenable
Narration of the introduction with word and sentence tracking, playback speeds from 0.8× to 1.5×, using the reader’s device voice.
The 12 signals
Each interaction is a “signal” the reader collects. Together they build a profile of the reader’s organization against the survey, ready to copy or print at the end.
| Signal | Type | What the reader does |
|---|---|---|
| 01 · Use cases | Data widget | Explores three charts (pp. 5, 6 and 10) in one view, filtered and sorted |
| 02 · Budget | Benchmark | Picks a current budget and expected increase to see how many peers sit above and below (p. 7) |
| 03 · Maturity | Self-locate | Sets the number of active projects and the stages they’re in |
| 04 · Barriers | Self-check | Ticks the technical barriers they face; a gauge shows how much of the list is a visibility problem (p. 13) |
| 05 · Trust loop | 12-second loop | Watches one incident handled in recommend, supervised and full-autonomy phases, and can scrub through it |
| 06 · Validation | Build your trust stack | Ticks the validation measures in use; each lights a segment of a shield, beside the share of respondents using it (p. 15) |
| 07 · Automation dial | Data widget | Drags from current to future across 15 functions, then sets a target share for their own function |
| 08 · Scorecard | Scorecard | Chooses a top priority and how success is measured (pp. 20–21) |
| 09 · Fault spread | Simulation | Picks a monitoring method, injects a fault and watches how far it travels through fourteen connected agents |
| 10 · Control-plane stack | Animated diagram | Lifts out layers and traces a request, comparing “probabilistic only” with “grounded in facts” |
| 11 · Regions | Regional lens | Compares every figure the report gives for the Americas, EMEA and APAC (pp. 30–32) |
| 12 · Quiz | Checkpoint | Answers five questions to take the pulse |
Reading experience and accessibility
Thirty-three widescreen pages become one continuous, responsive report that can be skimmed, read or heard.
Same findings, two depths
The Quick track keeps key insights, a 30-second gist per chapter and every interactive; the Deep track adds the supporting paragraphs and deep-dive notes.
Listen along
Device-voice narration with word or sentence tracking at 0.8× to 1.5×.
Reading settings
Text size, Auto, Dark, Light and Sepia themes and a readable typeface (Atkinson Hyperlegible).
Charts as real elements
Charts are built in the page, not pasted as images, so they stay sharp, responsive and readable by screen readers.
Announced results
Nineteen live regions announce widget results, verdicts and quiz feedback as they change.
Print and share
A print stylesheet, a “copy my profile” summary and progress that saves in the browser.
Design system
The report’s dark palette and particle-wave cover carry into the edition. A single action color marks everything the reader can use.
- Action
#4B44FFInteractive controls and selections - Dynatrace blue
#1496FFBrand accent - Dynatrace green
#73BE28Brand accent - Lime
#B4DC00Highlights on dark - Purple
#6F2DA8Brand accent - Seven-step spectrum
#2FA593 → #B523C4Ordered data in charts
Type
Barlow for display and reading, JetBrains Mono for data labels, sources and page references, and Atkinson Hyperlegible for the readable mode.
Published data stays published
Every survey figure appears as the report states it; interactive views only re-sort and filter it. Editorial additions are labelled.
Sources under every widget
Each data widget carries its page reference, so a reader can cite a number straight from the edition.
How it’s built
Research teams update reports every year. The build is designed to be updated, not rebuilt.
| Aspect | Approach |
|---|---|
| Delivery | One self-contained HTML file (about 860 KB) with all images embedded. No platform, plugin or reader app. |
| External requests | Only the web fonts, with system-font fallbacks |
| Data | Survey figures held as data in the page and drawn as HTML and SVG charts, so next year’s numbers replace this year’s without redrawing |
| Narration | The reader’s device voice through the Web Speech API, with word-level tracking |
| State | Collected signals, progress and settings saved in the reader’s browser; nothing is sent to a server |
| Content length | About 5,200 words of reading text, all selectable and searchable |
PDF vs interactive edition
The PDF is the record of the research. The edition is how most readers will actually use it.
| Question | Original PDF | Interactive edition |
|---|---|---|
| Where does my organization sit? | Compare by eye against a chart | Pick your answer and see peers above and below |
| Can I filter the use-case data? | Three separate fixed charts | One explorer with views, filters and sort orders |
| How does a fault spread? | A statement and a statistic | A simulation across fourteen agents |
| How do regions compare? | Three appendix pages | One regional lens |
| Can I take something away? | The whole PDF | A profile of my answers to copy or print |
| Is it the citable original? | Yes | It cites the original page by page |
What we would measure
This edition is an independent demonstration with no audience data, and we don’t report results for it. For a research publisher, the signals double as first-party data.
Audience profile
Budget bands, project counts and maturity stages chosen by readers describe the audience far better than a download count.
Barriers and priorities
Which barriers readers tick and which priorities they choose show where the publisher’s product conversation should start.
Completion and intent
Signals collected, quiz completion and clicks from the closing section to a demo or contact form.
Where this approach fits
Benchmarks are the strongest candidates for an interactive edition, because every reader wants to compare themselves with the data.
Annual surveys and benchmarks
“State of” reports where a self-locate widget turns each chart into a personal answer.
Analyst-style research
Reports with regional or segment cuts, where a single explorer replaces pages of appendix tables.
Maturity models
Frameworks where a reader’s answers place them on a ladder and suggest next steps.
FAQ
Common questions about this edition and projects like it.
Was this edition commissioned by Dynatrace?
No. It is an independent portfolio demonstration built from a report Dynatrace published. The findings are Dynatrace’s; the editorial layer, interactions, design and build are Studio Vektor’s.
Are any survey numbers changed?
No. Interactive views only filter, sort and compare the published figures, and each data widget cites its source page. Simulations are labelled as demonstrations.
What would an edition like this cost?
Interactive eBooks start from $635, and the Advanced package with one defined quiz or scoring tool and interactive charts starts from $1,170. An edition at this depth, with twelve interactive signals, simulations and narration, goes beyond those packages and is quoted on scope after we see your report.
Can next year’s report reuse the build?
Yes. Because charts are drawn from data in the page, a new year’s figures can replace the old ones, and the interactions carry over wherever the questions stay the same.
Publishing research?
Give your report a second life as an interactive edition.
Survey reports and benchmarks are ideal: readers want to compare themselves with the data. Send the report and we’ll show you how.