

- Studio Vektor
- Interactive eBooks
- Brex × Navan: T&E Program ROI
Case study · Interactive eBook
7 Strategies to Increase Your T&E Program ROI, made interactive
A travel-and-expense guide makes its case with numbers. The interactive edition lets finance readers put their own numbers in: six hands-on tools, a checkpoint quiz and reading settings, built from the 11-page Brex × Navan PDF.

- Publishers
- Brex and Navan
- Original format
- 11-page portrait PDF
- Edition
- 7 strategies, 6 tools, 1 checkpoint quiz
- Status
- Independent portfolio demonstration
An interactive edition of a guide published by Brex and Navan. The text and figures are theirs; the reading experience, tools and build are Studio Vektor’s. Not commissioned by, affiliated with or endorsed by Brex or Navan. Calculator inputs such as the 70% automation share are example assumptions, labelled as such in the edition; currency conversions use fixed example rates; the community thread and support chat are illustrative samples; photography is placeholder stock marked for replacement with licensed files.

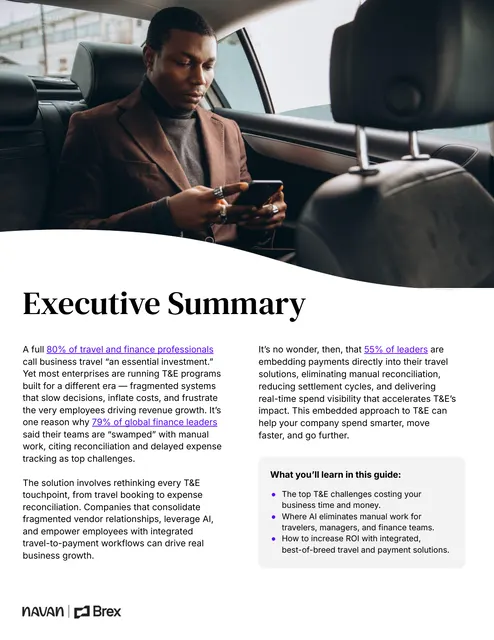
The starting point: an argument made of numbers
The PDF walks through seven strategies, from automating expense reports to enforcing policy at booking, each backed by statistics. The trouble with a static ROI argument is that every reader’s program is different. A finance lead reads “hours lost to expense reports” and has to do the arithmetic for their own team in their head.
The brief
Each strategy in the guide follows the same pattern: what it’s costing you, then how to fix it. The edition had to make both halves concrete for the reader’s own program.
Put the reader’s numbers in
Industry averages persuade nobody in a budget meeting. The edition needed to let a reader enter their own travelers, trips and filing time and see the result.
Show the fix happening
“Policy enforced at the point of booking” or “automatic receipt matching” are claims. Seen in action, they become a picture the reader can explain to someone else.
Keep finance readers’ trust
Every number had to be traceable: the guide’s figures, the reader’s inputs and any example assumption labelled differently, with nothing invented in between.
Who it is for
Finance leaders, travel managers and controllers who own a travel and expense program and need to justify changes to it.
The evaluator
Wants to know whether the savings apply to their company. The tools answer with their own inputs, not an average.
The busy reader
Picks the Quick track for the strategies, the tools and the key stats, with the deep-dive detail folded away.
The internal champion
Needs to share a single point with a CFO. Highlight, share and discussion features make that easy.
From PDF to edition, strategy by strategy
The seven strategies keep the guide’s order and its “What’s costing you / How to fix it” structure. Each opens with a short reflection prompt and adds one thing to try.
| Section | Reflection prompt | What the reader can do |
|---|---|---|
| Executive summary | How long did your last expense report take? | Listen to the summary with a read-along player; choose the Quick or Deep-dive track |
| 1 · Eliminate manual expense reports | Count the hours lost by quarter-end | Expense-hours calculator (travelers, trips per year, hours per report, automation share), plus manual vs intelligent approval routing |
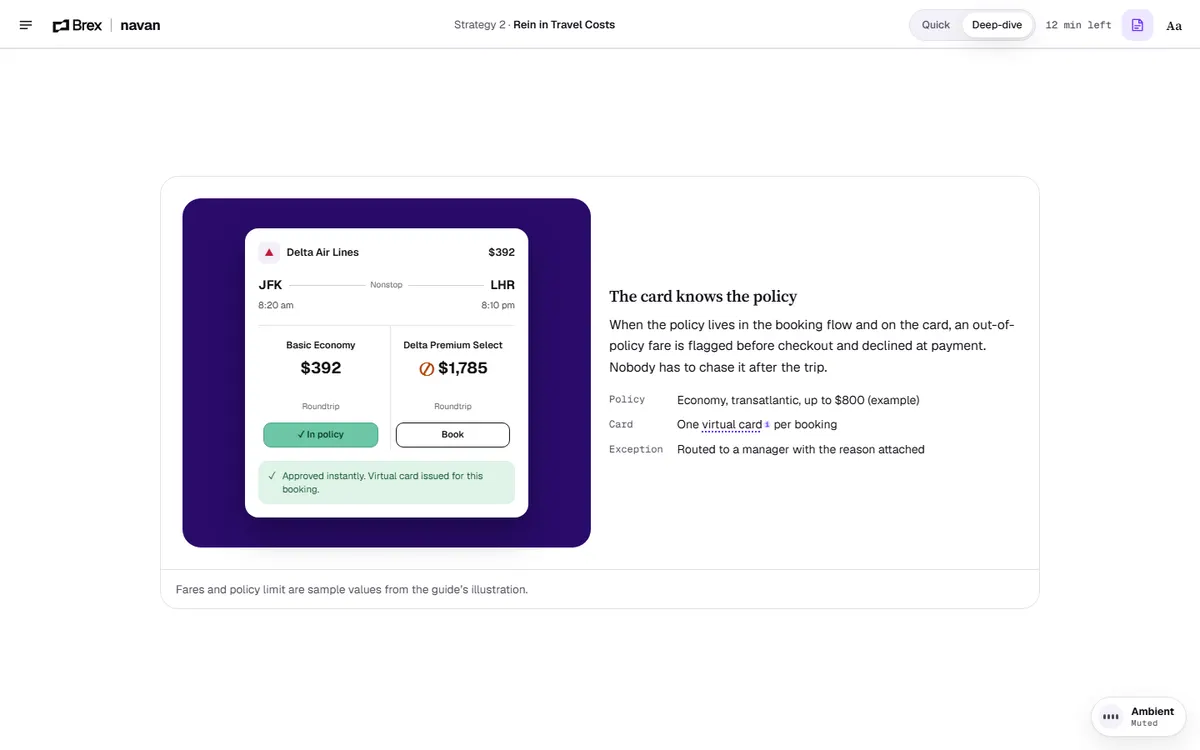
| 2 · Rein in travel costs | Leakage rarely looks like fraud | A booking card: an in-policy fare is approved with a virtual card; a premium fare is flagged before checkout |
| 3 · Support travelers at every turn | Is anyone awake when something goes wrong? | An illustrative support-chat loop showing 24/7 answers and pre-trip approval checks |
| 4 · Streamline reconciliation | Every manual match is a question asked weeks later | A matching diagram for card, booking and expense data, followed by a four-question checkpoint on strategies 1–4 |
| 5 · Make compliance seamless | An audit finds problems; a check at spend prevents them | An admin view of travel transactions, filterable by all, approved and flagged |
| 6 · Get more visibility into spend | Where would you want the warning? | Spend by department and regional budget cards with an alert threshold the reader drags |
| 7 · Think (and act) globally | Tax you never reclaim is a cost you chose | A receipt tool that splits a euro total into net amount and VAT, with a USD conversion at an example rate |
| Get started | n/a | A completion card with progress across 12 sections, saved in the browser, and options to share the guide |
What Studio Vektor did
Turned seven written strategies into seven sections that each pair an idea with something to try.
Made the ROI personal
Designed an expense-hours calculator (travelers, trips, filing time and automation share) that shows hours back each year, plus an approval-wait comparison between manual and routed approvals.
Showed policy instead of describing it
A booking card demonstrates in-policy and out-of-policy fares, so “policy at the point of booking” is something the reader sees happen.
Checked understanding
A four-question checkpoint recaps the four numbers people quote back in budget meetings, with instant feedback and a retry.
Gave readers control
Text size, Auto, Light, Sepia and Dark themes, dyslexia-friendly type, bionic emphasis, margin reflections and a calm-motion switch. Progress saves in the browser.
Interactive features
Six hands-on tools and a checkpoint, across seven strategies.

Expense-hours calculator
Four inputs: travelers, trips per traveler per year, hours to file one report and the share of that time automation removes. The 70% default is labelled as an example assumption, so a reader can replace it with their own.
Budget alert threshold
Regional budget cards from the guide’s sample dashboard, with a threshold the reader drags to decide when a warning should fire: half spent, or nearly gone.
VAT receipt tool
Enter a receipt total in euros and see the net amount and the 19% VAT split out, with a note that reclaimability depends on expense type and jurisdiction.
Highlight, share and discuss
Select any sentence to highlight, share or note it; a sample discussion thread shows how reader comments could work inside the guide.
Reading experience and accessibility
A finance reader opens this between meetings, on a phone, or during a budget review on a large screen. The edition is built for all three.
Two tracks
Quick Overview gives a one-paragraph gist per strategy, the fixes and the checkpoint; Deep-dive adds the full diagnosis. Both cover all seven strategies, and switching keeps the reader’s place.
Reflections in the margin
Each strategy opens with a short prompt that asks the reader to think about their own program before reading the fix.
Reading settings
Text size, Auto, Light, Sepia and Dark themes, a dyslexia-friendly typeface, bionic emphasis and calm motion, with a reset to defaults.
Definitions in place
Terms such as NDC, virtual card and OCR open a short definition without leaving the page.
Read-along summary
The executive summary has a read-along player with word or sentence highlighting.
Reduced motion respected
The fare and chat loops can be paused, motion follows the system’s reduced-motion setting, and live regions announce results.
Design system
Brex and Navan’s clean, white editorial style is kept. Violet is reserved for anything the reader can touch, so tools feel native to the guide.
- Violet
#6A2BF5Interactive controls and highlights - Indigo
#2A0B6BDark panels and the player - Ink
#100E17Body text - Paper
#F3F2F8Tool surfaces - Approved
#167A45In-policy and approved states - Flag
#B4470FOut-of-policy and flagged states
Type
Source Serif 4 for display headings, Geist for body text and interface, Geist Mono for figures and labels, and Atkinson Hyperlegible for the readable mode.
Assumptions on the surface
Every calculator states which numbers are the reader’s input, which are example assumptions and which come from the guide.
Status never by color alone
Approved and flagged states always carry a symbol and a word as well as a color.
How it’s built
Light enough to load anywhere and simple to host.
| Aspect | Approach |
|---|---|
| Delivery | One self-contained HTML file (about 680 KB) with all 15 images embedded. No platform, plugin or reader app. |
| External requests | Only the web fonts, with system-font fallbacks |
| Tools | Calculators and diagrams built in HTML, CSS and inline SVG, so they stay sharp and readable at any size |
| State | Section progress (12 sections) and reading settings saved in the reader’s browser; nothing is sent to a server |
| Audio | An optional ambient soundtrack generated in the browser, muted by default |
| Content length | About 3,200 words of reading text, all selectable and searchable |
PDF vs interactive edition
The PDF states the case. The edition lets the reader check it against their own program.
| Question | Original PDF | Interactive edition |
|---|---|---|
| Does the ROI apply to my company? | The reader does the math | The calculator does it with the reader’s inputs |
| What does the fix look like? | A screenshot and a description | A booking card, chat loop, matching diagram and admin view |
| Which numbers should I remember? | All of them, equally | A checkpoint singles out four |
| Can I share one point with my CFO? | Send the whole PDF | Highlight and share a single sentence or stat |
| Does it work on a phone? | Portrait pages, small type | Responsive layout and adjustable text |
| Can it be printed or attached? | Yes | Shared as a link; the PDF remains the print version |
What we would measure
This is an independent demonstration with no audience data, and we don’t report results for it. In a publisher’s deployment, the tools themselves become the data.
Program size
Calculator inputs (travelers, trips per year) show the size of the programs reading the guide, which is a qualification signal for sales.
Pain points
Which strategies readers finish, and where they set alert thresholds, show which problems matter most to this audience.
Intent
Checkpoint completion and clicks to a demo request, passed to the publisher’s CRM if needed (quoted separately).
Where this approach fits
Any document that argues with numbers is stronger when the reader can enter their own.
ROI and business-case guides
Content that has to survive a budget review, where a calculator lets a champion bring their own figures.
Buyer’s guides
Comparisons and evaluation guides, where a self-check or filter turns general advice into a recommendation.
Product-led playbooks
Strategy guides that show the product working, without becoming a product tour.
FAQ
Common questions about this edition and projects like it.
Was this edition commissioned by Brex or Navan?
No. It is an independent portfolio demonstration built from a guide Brex and Navan published. The text and figures are theirs; the tools, design and build are Studio Vektor’s.
Are the calculator results real data?
The calculators combine the guide’s published figures with the reader’s own inputs. Defaults such as the 70% automation share are labelled as example assumptions, and currency conversions use fixed example rates.
What would an edition like this cost?
Interactive eBooks start from $635, and the Advanced package with one defined quiz or scoring tool starts from $1,170. An edition with six tools, narration and two reading tracks goes beyond those packages and is quoted on scope after we see your document.
Can calculator answers be passed to our CRM?
Yes, as a separate integration. Calculator inputs and quiz results can be sent with a lead form to your marketing automation or CRM; that connection is scoped and quoted separately.
Selling with numbers?
Let buyers calculate the value themselves.
ROI guides, buyer’s guides and business cases convert better when readers can test them. Send yours and we’ll suggest the calculators worth building.