

- Studio Vektor
- Interactive eBooks
- Demandbase: Sales Intelligence Playbook
Case study · Interactive playbook
Sales Intelligence Playbook, from product brochure to working dashboards
Product playbooks describe dashboards readers can’t touch. The interactive edition of Demandbase’s playbook lets sellers filter people data, set up agents and find warm paths through their connections, then see how much each step could lift their response rate.

- Publisher
- Demandbase
- Original format
- 34-page landscape PDF playbook
- Edition
- 5 chapters, working mock-ups, a scorecard
- Status
- Independent portfolio demonstration
An interactive edition of a playbook Demandbase published. The playbook’s text, figures and works cited are as published; the author reflections, mock-up dashboards, sample contacts, quiz and scorecard were written for this edition by Studio Vektor. Not commissioned by, affiliated with or endorsed by Demandbase. Dashboards are simplified mock-ups with fictional accounts and contacts.

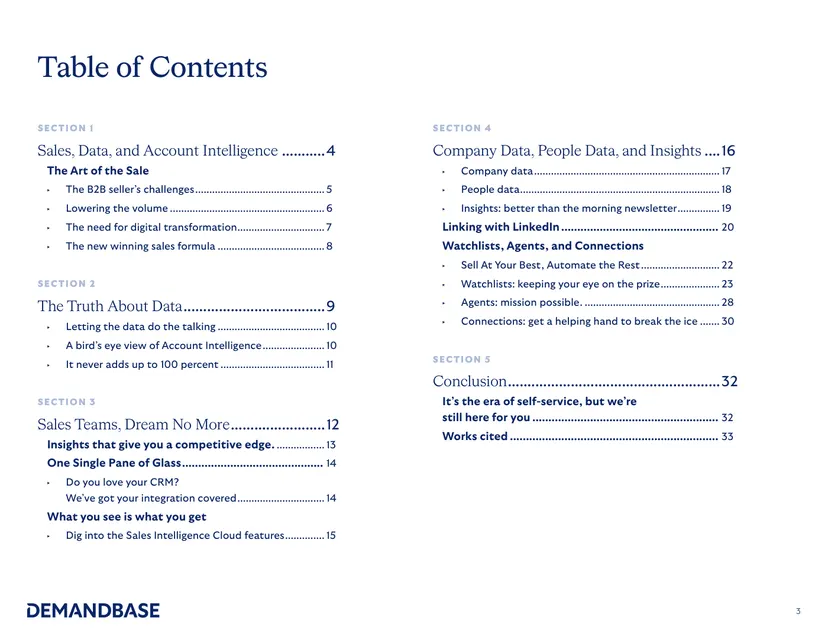
The starting point: a product playbook for sellers
The playbook explains why volume-based selling has stopped working and how account intelligence, combining first-party data with third-party insights, helps sellers find the right accounts, people and moments. Its second half tours the product’s company data, people data, insights, agents and connections. In print it is 34 widescreen pages, and the dashboards are screenshots.
The brief
Sellers learn tools by using them. The edition had to let readers work the dashboards and see what each feature does for their numbers.
Start with the seller
Open with the challenges reps face and let readers tick their own.
Let readers use the product
Turn screenshots into simplified, working mock-ups with fictional data.
Tie it to outcomes
Connect each feature to response rates, and finish with a personal scorecard.
Who it is for
Account executives, SDRs and the sales leaders who equip them.
Sellers
Filter people data, set up agents and find warm introductions.
Sales leaders
See how fewer, better-targeted attempts raise response rates.
Revenue operations
Understand each data set and the hurdle it was designed to clear.
From PDF to edition, chapter by chapter
The edition keeps the playbook’s five chapters.
| Chapter | The playbook’s point | In the interactive edition |
|---|---|---|
| 1 · Sales, data and account intelligence | Sales is no longer a numbers game; buyers have raised the bar | A challenges self-check, a response-rate exercise and the new winning formula in three parts |
| 2 · The truth about data | Account intelligence is never 100% complete | An author reflection and the playbook’s case for honest data |
| 3 · Sales teams, dream no more | One pane of glass, inside the CRM | Flip cards pairing each sales hurdle with the data set designed for it |
| 4 · Company data, people data and insights | Know the account, find the person, time the outreach | Working mock-ups: company dashboard tabs, people filters, insight signals, agents and connections |
| 5 · Conclusion | Training, office hours and your CSM | A five-question quiz and a personal playbook scorecard |
What Studio Vektor did
Turned a product tour into something sellers can operate.
Built working mock-ups
Company and people dashboards, insight feeds and agent settings run in the page with fictional accounts and contacts.
Measured the lift
A response-rate exercise shows how much each practice could raise response rates; the playbook calls back to it when Connections, the biggest lift, appears.
Added the author’s voice
Short author reflections, written for this edition, add context such as “anyone promising perfect data is selling something else”.
Scored the reader
A personal playbook scorecard fills in as the reader works through the chapters.
Key interactives
Every chapter has a working part, and the scorecard keeps track.
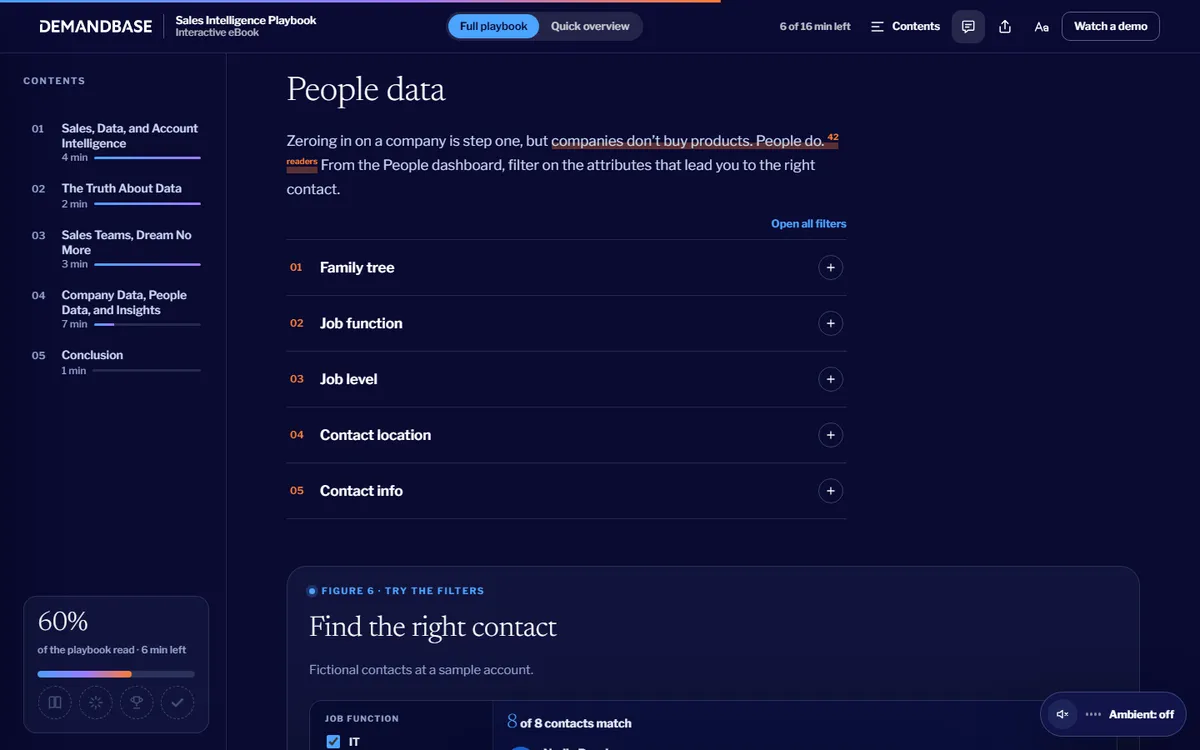
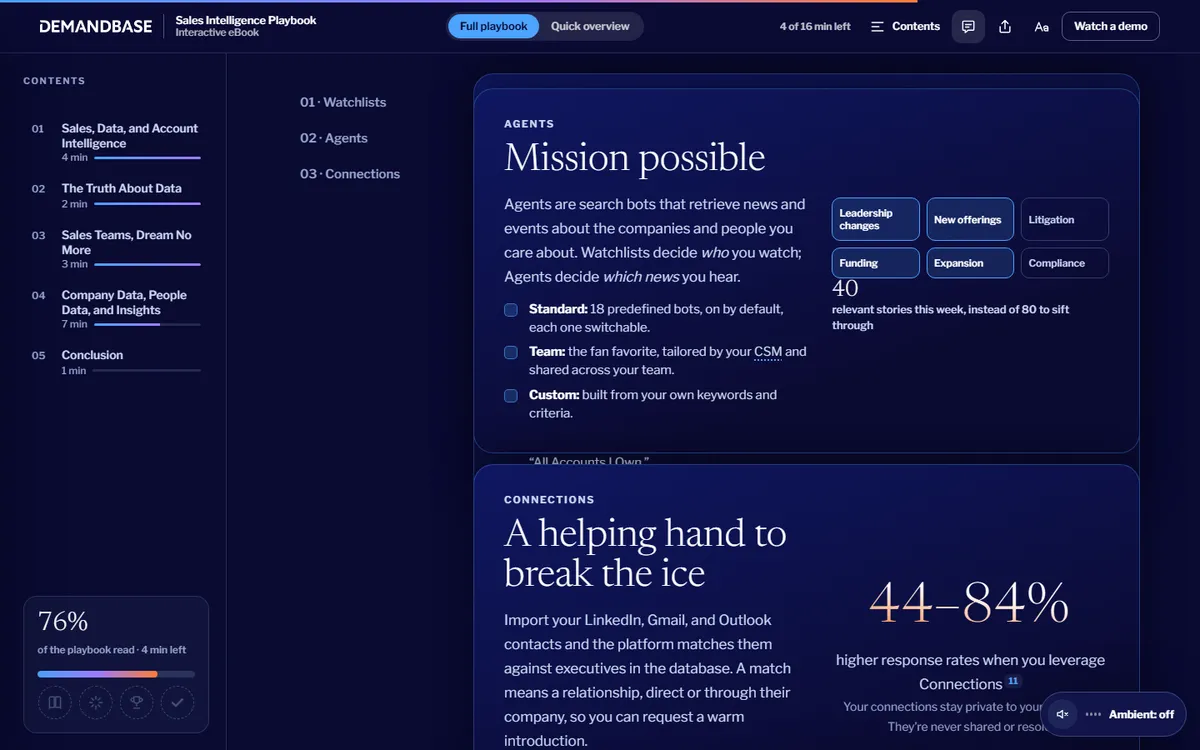
| Interactive | Type | What the reader does |
|---|---|---|
| Which challenges are you up against? | Self-check | Taps every challenge they face today |
| Response-rate builder | Calculator | Adds practices and watches the expected response rate rise |
| The new winning formula | Reveal | Opens three ways to change the seller’s experience |
| What you see is what you get | Flip cards | Flips each sales hurdle to see the data set that solves it |
| Company data | Mock-up dashboard | Selects each tab of a sample company dashboard |
| People data | Mock-up filters | Filters fictional contacts to find the right person |
| Insights | Signal feed | Explores signals such as intent surges, leadership changes and buying groups |
| Agents | Settings | Chooses standard, team or custom agents and sees fewer, more relevant stories |
| Connections | Warm-path finder | Finds a relationship that leads to an introduction |
| Quiz and scorecard | Checkpoint | Answers five questions and completes a personal scorecard |
Reading experience and accessibility
Thirty-four widescreen pages become one responsive playbook with a chapter rail.
Two tracks
The full playbook or a quick overview of what each feature does.
Listen along
Each chapter can be read aloud using the reader’s device voice.
Reading settings
Text size, themes and bionic emphasis.
Chapter rail
A contents rail shows reading time per chapter and progress through the playbook.
Announced results
Nineteen live regions announce dashboard and quiz results.
Sources kept
The playbook’s works cited are listed at the end with links.
Design system
Demandbase’s deep navy with sky blue, and ember for the moments that matter.
- Night
#0A0A32Grounds and panels - Sky
#4CA3FFActions, selections and data - Ember
#FF7C33Highlights and calls to action - Mint
#5BE38APositive results - Violet
#9B7BFFSecondary data
Type
Newsreader for display and Libre Franklin for reading and interface, embedded in the file.
Editorial feel
A serif display face and a contents rail give a product playbook the feel of a magazine.
Mock-ups, labelled
Every dashboard is labelled as a simplified mock-up with fictional data.
How it’s built
Mock-ups are built from data in the page, so new features or fields can be added as the product changes.
| Aspect | Approach |
|---|---|
| Delivery | One self-contained HTML file (about 1.8 MB) with its images embedded. No platform, plugin or reader app. |
| External requests | None for fonts, which are embedded in the file; only a page-view analytics tag |
| Narration | The reader’s device voice through the Web Speech API, with word or sentence tracking |
| State | Answers, progress and settings saved in the reader’s browser |
PDF vs interactive edition
The PDF shows the product. The edition lets sellers use it.
| Question | Original PDF | Interactive edition |
|---|---|---|
| How do I find the right contact? | A screenshot of filters | Working filters on sample contacts |
| Which news matters? | A description of agents | Agent settings that change the feed |
| What will this do for my numbers? | Statistics | A response-rate builder |
| Did I take it in? | No check | A quiz and a personal scorecard |
What we would measure
This edition is an independent demonstration with no audience data, and we don’t report results for it. For a sales-intelligence vendor, readers’ answers describe their sales motion.
Challenges
Which challenges readers tick.
Feature interest
Which mock-ups readers spend time in.
Intent
Scorecards completed and clicks to watch a demo.
Where this approach fits
Product playbooks gain the most when readers can operate the product.
Product tours
Screenshots replaced by working mock-ups.
Sales enablement
Playbooks with exercises and scorecards.
Feature launches
Editions that show each feature’s outcome.
FAQ
Common questions about this edition and projects like it.
Was this edition commissioned by Demandbase?
No. It is an independent portfolio demonstration built from a playbook Demandbase published. The playbook is Demandbase’s; the editorial layer, interactions, design and build are Studio Vektor’s.
Are the dashboards the real product?
No. They are simplified mock-ups with fictional accounts and contacts, built to show what each feature does.
What would an edition like this cost?
Interactive eBooks start from $635, and the Advanced package with one defined quiz or scoring tool and interactive charts starts from $1,170. An edition at this depth, with working mock-ups, a response-rate builder and a scorecard, goes beyond those packages and is quoted on scope after we see your document.
Can it be used for sales training?
Yes. The quiz, scorecard and mock-ups suit onboarding, and a commissioned edition can report completion to your enablement team.
Publishing a product playbook?
Let readers use the product as they read.
Product playbooks and sales-enablement guides work well. Send the PDF and we’ll show you how.