

- Studio Vektor
- Interactive eBooks
- Airtable: The Ultimate AI Guide for Marketers
Case study · Interactive guide
The Ultimate AI Guide for Marketers, with something to try at every step
Airtable’s guide walks marketers through bringing AI into campaign work, from organization to measurement. The interactive edition pairs each step with something to try: categorize feedback with AI, generate copy for four channels and simulate a five-market rollout.

- Publisher
- Airtable
- Original format
- 14-page PDF eBook
- Edition
- 5 steps, 5 checkpoints, 8 badges
- Status
- Independent portfolio demonstration
An interactive edition of an eBook Airtable published. The guide’s text and examples are as published; the demos, sample data, checkpoints and badges were written for this edition by Studio Vektor. Not commissioned by, affiliated with or endorsed by Airtable. Sample feedback, campaigns and budgets in the demos are illustrative.

The starting point: a step-by-step guide
The guide uses a kitchen metaphor, mise en place, to walk marketers through five phases of campaign work: organization, planning, production, distribution and measurement, with Airtable AI examples in each. In print it is 14 pages, and the examples are screenshots of a product the reader can’t touch.
The brief
A how-to guide is most convincing when the reader does the thing. The edition had to replace each screenshot with a small working version.
A try-it in every step
Each phase gets an interactive demo of the task it describes.
Progress that rewards
Checkpoints and badges give a reason to finish the guide.
Shareable ideas
Readers can highlight passages and share quotes.
Who it is for
Marketing teams and marketing-operations leads adopting AI in campaign work.
Campaign managers
Try categorizing feedback, generating copy and planning a rollout.
Marketing ops
Run the self-check on workflows, silos and sources of truth.
Marketing leaders
Take the Quick track and the scorecard.
From PDF to edition, chapter by chapter
The edition keeps the guide’s five phases and its kitchen metaphor.
| Chapter | The guide’s point | In the interactive edition |
|---|---|---|
| Organization | Mise en place: gather and connect your data first | An animated process from silos to a single source of truth, and a readiness self-check |
| Planning | Amazing campaigns come from killer insights | A click-to-reveal research example and AI categorization of 17 pieces of feedback |
| Production | Get creative and automate approvals | One brief turned into copy for four channels with a tone slider, and automatic approver notifications |
| Distribution | Localize and launch | A rollout simulation from New York to London, Paris, Madrid and Berlin, and an eight-second launch loop |
| Measure | Keep score to keep learning | A budget-allocation slider chart and the campaign flywheel |
| Scorecard and close | About Airtable | A personal scorecard and an index of every pattern used in the edition |
What Studio Vektor did
Replaced product screenshots with demos the reader can run.
Ran the AI on sample data
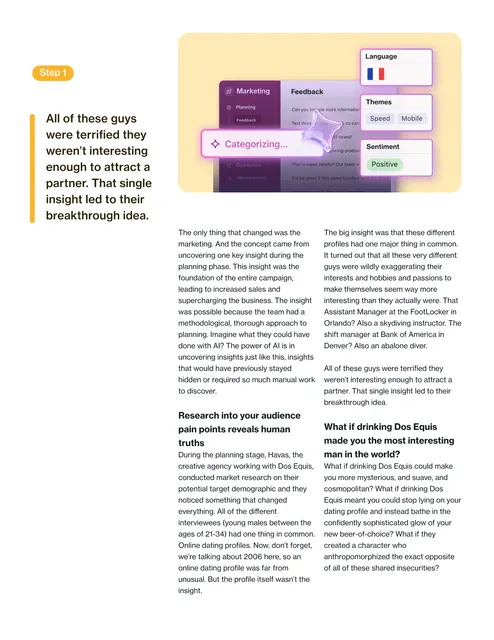
Seventeen pieces of sample feedback can be categorized by sentiment and theme, then filtered like the guide’s Airtable example.
Generated from one brief
A single campaign brief becomes copy for four channels, with a slider for tone of voice.
Simulated a rollout
A campaign line launches across five markets in sequence, with dialect-aware Spanish for Spain and Argentina.
Showed the method
A closing index lists every pattern in the edition, from self-checks to animated processes, numbered like a catalogue.
Key interactives
Every step pairs the guide’s idea with something to try.


| Interactive | Type | What the reader does |
|---|---|---|
| Data en place | Animated process | Connects workflows and watches silos become one source of truth |
| Is your mise en place ready? | Self-check | Ticks the workflow and data practices already in place |
| Spot the pattern | Click-to-reveal | Reveals profiles to find the pattern the researchers found |
| Find the pattern in 17 pieces of feedback | Data widget | Runs AI categorization and filters by sentiment |
| One brief, four channels | Slider-driven output | Moves a tone slider and sees copy change across channels |
| Notify approvers | Automation demo | Sees approvers alerted as assets come back |
| Launch in five markets | Simulation | Rolls a campaign out across five markets and languages |
| Budget allocation | Slider chart | Chooses a range of quarters and summarizes it |
| Your scorecard | Progress | Collects checkpoints and badges across the guide |
Reading experience and accessibility
Fourteen print pages become one responsive guide built to be finished.
Two tracks
Quick overview keeps the lead idea of each step, every interactive and a one-card summary; the full track keeps everything.
Listen along
Read-aloud for each step with word and sentence tracking, using the reader’s device voice.
Reading settings
Text size, Auto, Light, Dark and Sepia themes, dyslexia-friendly type (Atkinson Hyperlegible) and bionic emphasis.
Highlight and share
Readers can highlight passages and share quotes from the guide.
Announced results
Fifteen live regions announce demo results and progress.
Progress and badges
Five checkpoints and eight badges, with progress saved in the browser.
Design system
Airtable’s purple with its yellow and blue product colors used for data.
- Purple
#5A22A6Brand and headings - Violet
#6B2FD0Actions and selections - Airtable yellow
#FCB400Highlights and data - Airtable blue
#18BFFFData and diagrams - Highlight
#FFE38AReader highlights
Type
Inter Tight for display, Inter for reading, JetBrains Mono for labels, and Atkinson Hyperlegible for the dyslexia-friendly mode.
Numbered patterns
Each interactive carries a pattern number, and the closing index explains them all.
Sample data, labelled
Demos say where their sample data comes from.
How it’s built
Each step is self-contained, so examples can be swapped as the product changes.
| Aspect | Approach |
|---|---|
| Delivery | One self-contained HTML file (about 270 KB) with its images embedded. No platform, plugin or reader app. |
| External requests | The web fonts, with system-font fallbacks, and a page-view analytics tag |
| Narration | The reader’s device voice through the Web Speech API, with word or sentence tracking |
| State | Answers, progress and settings saved in the reader’s browser |
PDF vs interactive edition
The PDF shows the product in screenshots. The edition lets readers try the tasks.
| Question | Original PDF | Interactive edition |
|---|---|---|
| How does AI categorize feedback? | A screenshot | Run it on 17 sample entries |
| What does one brief produce? | An example | Copy for four channels with a tone slider |
| How does localization work? | A description | A five-market rollout simulation |
| Will I finish it? | No reason to | Checkpoints, badges and a scorecard |
What we would measure
This edition is an independent demonstration with no audience data, and we don’t report results for it. For a work-management platform, the demos readers try reveal their use case.
Use case
Which phase’s demos readers try most.
Readiness
Self-check answers on workflows and data.
Completion
Checkpoints reached, badges earned and clicks to the product.
Where this approach fits
How-to guides become far more convincing when readers can do the task.
Product-led guides
Screenshots replaced by working demos.
Process playbooks
Step-by-step guides with a try-it in each step.
Enablement content
Editions with checkpoints and badges that people finish.
FAQ
Common questions about this edition and projects like it.
Was this edition commissioned by Airtable?
No. It is an independent portfolio demonstration built from an eBook Airtable published. The guide is Airtable’s; the editorial layer, interactions, design and build are Studio Vektor’s.
Do the demos use the real product?
No. They are lightweight recreations that run in the page with sample data, labelled as illustrative.
What would an edition like this cost?
Interactive eBooks start from $635, and the Advanced package with one defined quiz or scoring tool and interactive charts starts from $1,170. An edition at this depth, with a demo in every step, checkpoints and badges, goes beyond those packages and is quoted on scope after we see your document.
Can the demos use our data?
Yes. In a commissioned edition, demos can be built around your own sample data and product terminology.
Publishing a how-to guide?
Let readers try every step.
Product-led guides and process playbooks work well. Send the PDF and we’ll show you how.