

- Studio Vektor
- Interactive eBooks
- Cvent × ON24: The State of AI in B2B Marketing
Case study · Interactive report
The State of AI in B2B Marketing, from survey report to self-assessment
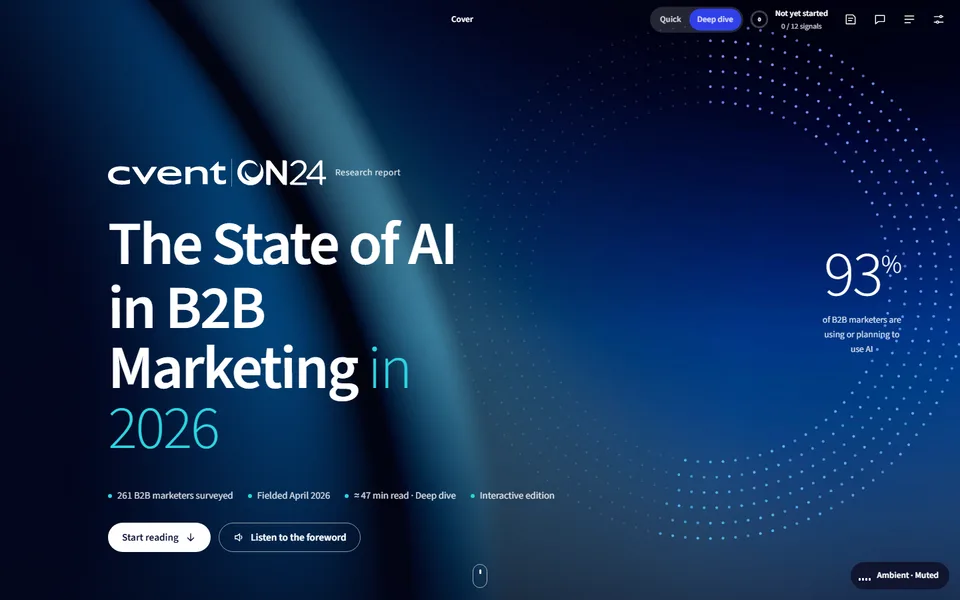
Survey reports tell marketers what their peers do. The interactive edition of Cvent and ON24’s 2026 report lets readers place themselves against 261 B2B marketers, build a campaign-in-a-box and score their own readiness, with the findings kept as published.
- Publisher
- Cvent × ON24
- Original format
- 27-page landscape PDF report
- Edition
- 6 chapters, 12 signals, a self-check
- Status
- Independent portfolio demonstration
An interactive edition of a research report Cvent and ON24 published. Survey findings, chart data and page references are as published; the 30-second summaries, deep dives, worksheets, loop and self-check were written for this edition by Studio Vektor. Not commissioned by, affiliated with or endorsed by Cvent or ON24. Illustrative timings and counts are labelled as such.
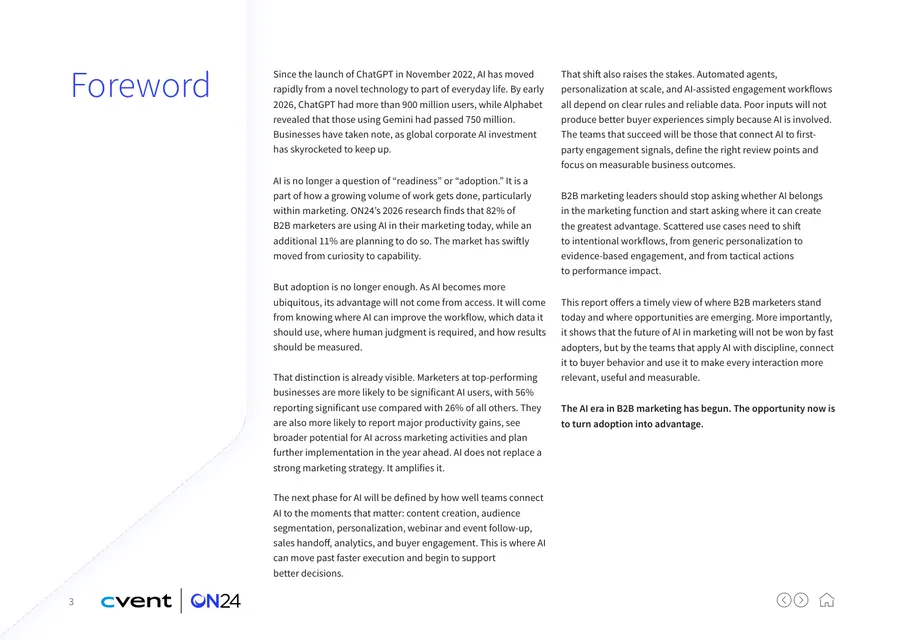
The starting point: a landscape survey report
The report surveys 261 B2B marketers on how they use AI, what it does for performance and productivity, where practice lags potential and what an AI operating model needs. In print it is 27 widescreen pages of bar charts and stat callouts, with tips in the margins. Every chart answers the same unspoken question: how does my team compare?
The brief
A benchmark report is most useful when readers can find themselves in it. The edition had to make every chart a comparison without changing any published number.
Benchmark the reader
Ask readers where they sit before each key chart, then show the survey with their answer marked.
Turn tips into tools
The report’s checklists and recommendations become worksheets: a campaign-in-a-box, a data audit and a workflow card.
End with a score
A nine-step self-check pulls earlier answers together into one readiness score the reader can take back to the team.
Who it is for
B2B marketing leaders and marketing operations teams deciding how far to take AI.
Marketing leaders
Compare their team’s AI use and pressure points with peers, then take the readout to planning.
Event and webinar teams
Use the campaign-in-a-box checklist to turn one webinar into a full campaign.
Marketing ops
Audit first-party data for personalization and draft the first workflow to scale.
From PDF to edition, chapter by chapter
Each chapter shows the page range it covers in the original report.
| Chapter | The report’s finding | In the interactive edition |
|---|---|---|
| Foreword and introduction (pp. 3–4) | AI is now mainstream in B2B marketing | A read-aloud foreword with word or sentence tracking, the headline numbers and a choice of Quick or Deep-dive track |
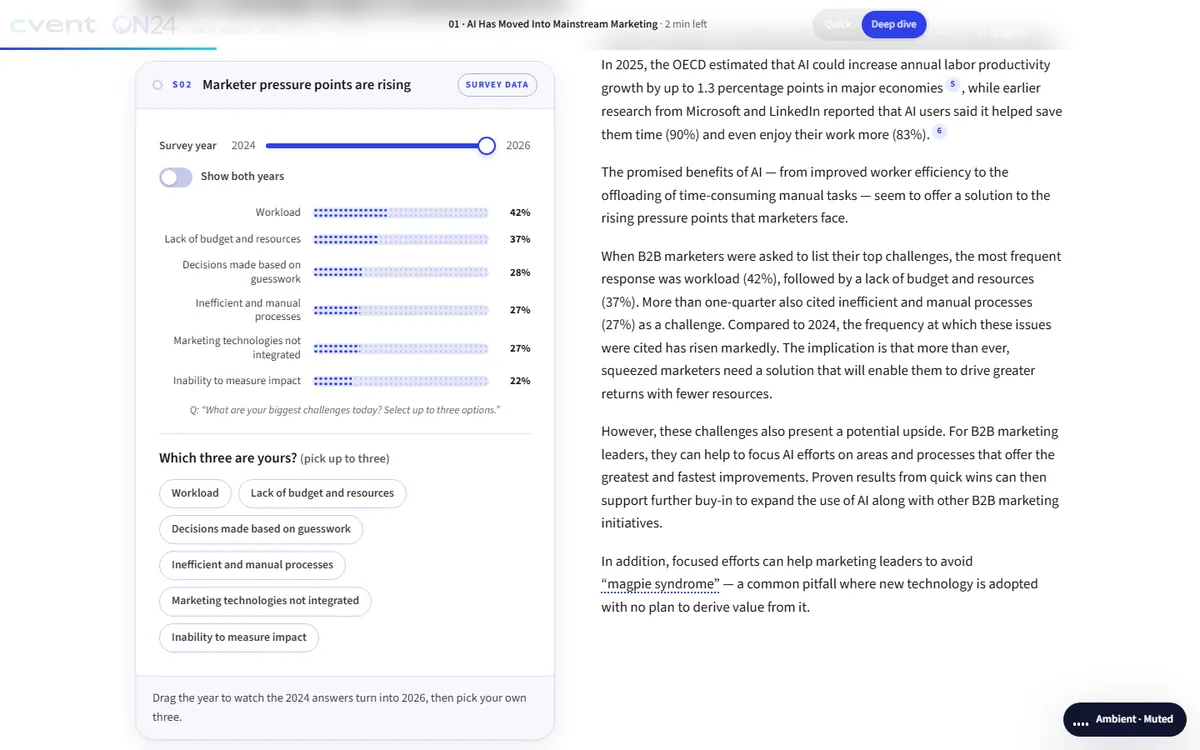
| 1 · AI in mainstream marketing (pp. 5–7) | 93% use or plan to use AI; workload tops the list of challenges | A where-do-you-sit question and a challenges chart that moves from 2024 to 2026 as the reader picks their top three |
| 2 · Performance and productivity (pp. 8–12) | Significant AI users report wider lifts in productivity | A performance split chart, a 12-second loop of one campaign run ad hoc and repeatably, and a six-step campaign-in-a-box checklist |
| 3 · Practice lags potential (pp. 13–16) | More marketers see AI’s potential than use it, and data practices limit personalization | A sortable gap chart where readers mark their own activities, and a personalization data audit |
| 4 · Leaders widen their lead (pp. 17–19) | Significant users plan more AI and more agents | An agent-or-human-in-the-loop sorter and a chart of reasons to invest |
| 5 · The future of B2B marketing (pp. 20–22) | Future success needs an AI operating model built on first-party data | Agree-or-disagree statements compared with peers and a five-field workflow card |
| 6 · Adoption to advantage (pp. 23–25) | Nine steps from adoption to advantage | A nine-step self-check that can prefill from earlier answers, then a readout to copy, share or print |
What Studio Vektor did
Kept the survey intact and built a benchmarking layer around it.
Put the reader in every chart
Before key charts, readers answer the survey question themselves; the chart then shows where they sit among 261 peers.
Made the years move
The challenges chart can be dragged from 2024 to 2026, so the shift in marketers’ pressure points is something readers watch rather than compute.
Turned checklists into worksheets
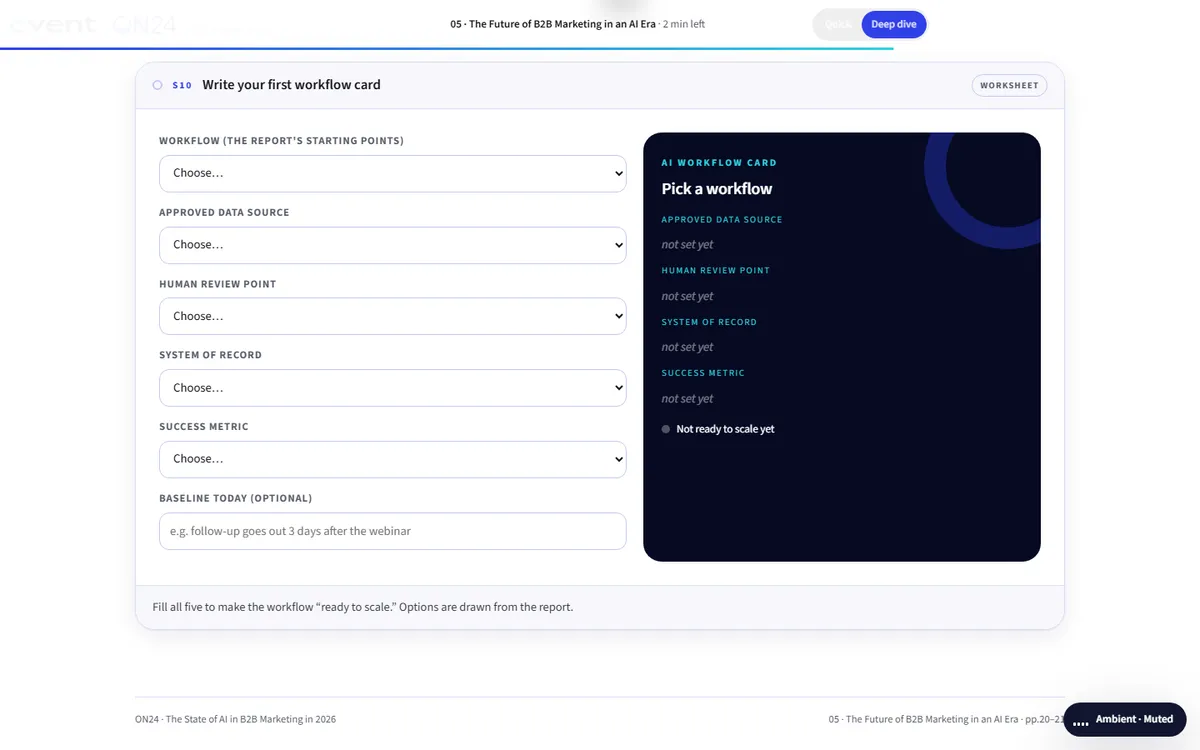
The report’s six-step webinar checklist and its operating-model advice became a campaign-in-a-box builder and a workflow card with five required fields.
Summed it up
The final nine-step self-check reuses earlier answers and produces an advantage-readiness score out of 100.
The 12 signals
Each interaction lights a signal. The readout at the end gathers the reader’s answers into one page.
| Interactive | Type | What the reader does |
|---|---|---|
| Where do you sit? | Benchmark | Picks their team’s level of AI use and sees the survey split |
| Pressure points | Data widget | Drags between 2024 and 2026 and picks their own top three challenges |
| The performance split | Data widget | Switches between business performance and personal productivity |
| One campaign, two ways | 12-second loop | Watches one campaign run ad hoc and then repeatably |
| Campaign-in-a-box | Checklist | Ticks the report’s six steps and watches one webinar fan out into a campaign |
| Potential vs. practice | Sortable chart | Sorts activities by potential, use or gap and marks where their team uses AI |
| Personalization data audit | Self-check | Selects the data they use and compares with the survey |
| Agent, or human-in-the-loop? | Sorter | Decides which tasks suit an agent and which need a person |
| Reasons to invest | Data widget | Compares significant and partial AI users’ reasons to invest |
| Do you agree? | Opinion poll | Agrees or disagrees with statements and sees how peers answered |
| Workflow card | Worksheet | Fills five fields to make a first workflow ready to scale |
| Nine-step self-check | Assessment | Ticks actions across nine steps for a readiness score out of 100 |
Reading experience and accessibility
Twenty-seven widescreen pages become one responsive report that reads well on a phone.
Two tracks
Quick overview keeps the 30-second summaries, every chart and every interactive; Deep dive adds the full text and editor’s deep dives.
Listen along
A read-aloud foreword with word or sentence tracking at 0.8× to 1.5×, using the reader’s device voice.
Reading settings
Text size, Auto, Light, Dark and Sepia themes, dyslexia-friendly type (Atkinson Hyperlegible) and bionic emphasis.
Charts as real elements
Charts are drawn in the page, so they stay sharp, sort and filter, and can be read by assistive technology.
Announced results
Fifteen live regions announce chart readouts and self-check results.
Take it back to the team
The closing readout can be copied, shared or printed; nothing is sent anywhere unless the reader does so.
Design system
ON24’s electric blue on deep night tones, with the report’s cyan and orange as data colors.
- ON24 blue
#3040E8Actions and selections - Night
#060A22Cover and dark panels - Cyan
#2CD5E0Highlights and the reader’s own answers - Orange
#F5821FComparison series - Accents
#B44CE0 → #F2CF1ASecondary data series
Type
Source Sans 3 for display and reading, and Atkinson Hyperlegible for the dyslexia-friendly mode.
Your answer, marked
Wherever the reader answers a question, their answer appears in the chart in a distinct color beside the survey result.
Labels on every widget
Tags such as “Survey data”, “Illustrative” or “Worksheet” say where each number comes from.
How it’s built
Research teams publish this kind of report every year. The build keeps the data separate from the interactions.
| Aspect | Approach |
|---|---|
| Delivery | One self-contained HTML file (about 290 KB) with its images embedded. No platform, plugin or reader app. |
| External requests | The web fonts, with system-font fallbacks, and a page-view analytics tag |
| Narration | The reader’s device voice through the Web Speech API, with word or sentence tracking |
| State | Answers, progress and settings saved in the reader’s browser |
| Data | Survey figures held as data in the page and drawn as HTML and SVG charts, so next year’s numbers replace this year’s |
PDF vs interactive edition
The PDF is the record of the survey. The edition is where readers benchmark against it.
| Question | Original PDF | Interactive edition |
|---|---|---|
| How does my team compare? | Compare by eye against each chart | Answer first and see your position marked |
| What changed since 2024? | Two years side by side | Drag between the years |
| How do I start with webinars? | A six-step checklist | A checklist that builds the campaign as you tick |
| Are we ready? | Nine steps to read | A self-check with a score out of 100 |
| Can I share my answers? | The whole PDF | A readout to copy, share or print |
What we would measure
This edition is an independent demonstration with no audience data, and we don’t report results for it. For a marketing-technology publisher, the readers’ answers are first-party data.
Audience maturity
AI-use levels, challenges and self-check scores describe who is reading.
Where to start the conversation
Which steps readers leave unticked shows where the publisher’s product can help.
Intent
Completed workflow cards, shared readouts and clicks to the publisher’s site.
Where this approach fits
Annual surveys gain the most when every reader can answer the questions themselves.
State-of-the-industry reports
Surveys where a where-do-you-sit question turns each chart into a benchmark.
Year-on-year research
Reports with repeat questions, where a slider shows the change.
Readiness models
Frameworks that end with a self-check and a score.
FAQ
Common questions about this edition and projects like it.
Was this edition commissioned by Cvent or ON24?
No. It is an independent portfolio demonstration built from a report Cvent or ON24 published. The research is Cvent’s and ON24’s; the editorial layer, interactions, design and build are Studio Vektor’s.
Are any survey numbers changed?
No. Interactions only re-sort, filter and compare the published figures. The loop and worksheets are labelled as illustrative or editorial.
What would an edition like this cost?
Interactive eBooks start from $635, and the Advanced package with one defined quiz or scoring tool and interactive charts starts from $1,170. An edition at this depth, with twelve signals, worksheets and a scored self-check, goes beyond those packages and is quoted on scope after we see your document.
Can next year’s report reuse the build?
Yes. The charts read from data in the page, so a new year’s survey can replace this one and the benchmarks carry over wherever the questions repeat.
Publishing survey research?
Let every reader benchmark against your data.
Annual surveys and state-of-the-industry reports are ideal. Send the report and we’ll show you how.