

- Studio Vektor
- Interactive eBooks
- Metadata: The CMO’s Guide to Modern Marketing
Case study · Interactive guide
The CMO’s Guide to Modern Marketing, from 11 pages to a marketing lab
Thought-leadership guides make claims about what good marketers do. The interactive edition of the guide by GTM Partners, presented by Metadata.io, lets readers run a year of experiments, switch from vanity to board metrics and assess their own maturity on ten scales.

- Publisher
- Metadata.io with GTM Partners
- Original format
- 11-page PDF guide
- Edition
- Simulators, a 10-scale assessment, 12 voices
- Status
- Independent portfolio demonstration
An interactive edition of a guide published by GTM Partners and presented by Metadata.io. The guide’s text, cited figures and practitioner quotes are as published; the field notes, simulators, assessment scoring and quiz were written for this edition by Studio Vektor. Not commissioned by, affiliated with or endorsed by Metadata.io or GTM Partners. Simulator figures are illustrative.

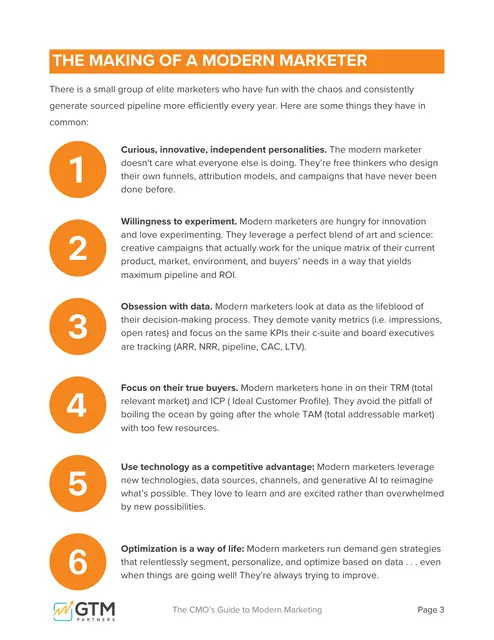
The starting point: a short opinion-led guide
The guide argues that a small group of elite marketers thrive on today’s chaos and sets out the habits that separate them: independent thinking, experimentation, board-level data, focus and alignment with the business. It closes with a maturity assessment and quotes from practitioners. In print it is 11 pages, and the assessment is a static table.
The brief
Opinion pieces persuade best when readers can test the argument. The edition had to let marketing leaders try each habit, not just read about it.
Simulate the habits
Give each trait a small model the reader can run: experiments over a year, two dashboards, three ways to target accounts.
Score the reader
Turn the printed maturity table into an assessment that places the reader on each of ten scales.
Keep the voices
Make the practitioner quotes browsable by theme rather than a list at the back.
Who it is for
CMOs, VPs of marketing and the leaders who report to them.
CMOs
Assess their organization on ten scales and see where it is strongest and weakest.
Demand and growth leaders
Run the experiment and targeting simulators to make the case for focus.
Marketing ops
Use the dashboard switch to argue for board-level metrics.
From PDF to edition, chapter by chapter
Each section of the edition shows the page it comes from in the guide.
| Chapter | The guide’s point | In the interactive edition |
|---|---|---|
| Introduction (p. 2) | The old pipeline playbook has stopped working | A read-aloud introduction and an attribution micro-loop showing marketing and sales claiming the same deals |
| Forging a new path (p. 2) | Modern marketers fail forward | A year-of-experiments simulator with a culture switch |
| The making of a modern marketer (p. 3) | Six habits separate the elite | Six reveal cards, a vanity-versus-board dashboard and a TAM, TRM or ICP targeting model |
| The business of marketing (p. 4) | Marketing must follow company strategy, P&L and NRR | Square multipliers (23×, 19×, 7×) for how much more likely data-driven companies are to win, from the McKinsey figures the guide cites |
| Maturity assessment (pp. 5–7) | A modern marketing maturity model | Ten five-step scales with a scored profile, focus-first actions and copy or download |
| Modern marketers (pp. 8–10) and finish (p. 11) | Practitioner perspectives | A five-question quiz, twelve voices filterable by theme and a note on how the edition is built |
What Studio Vektor did
Gave every claim in the guide a way to be tried.
Built small simulators
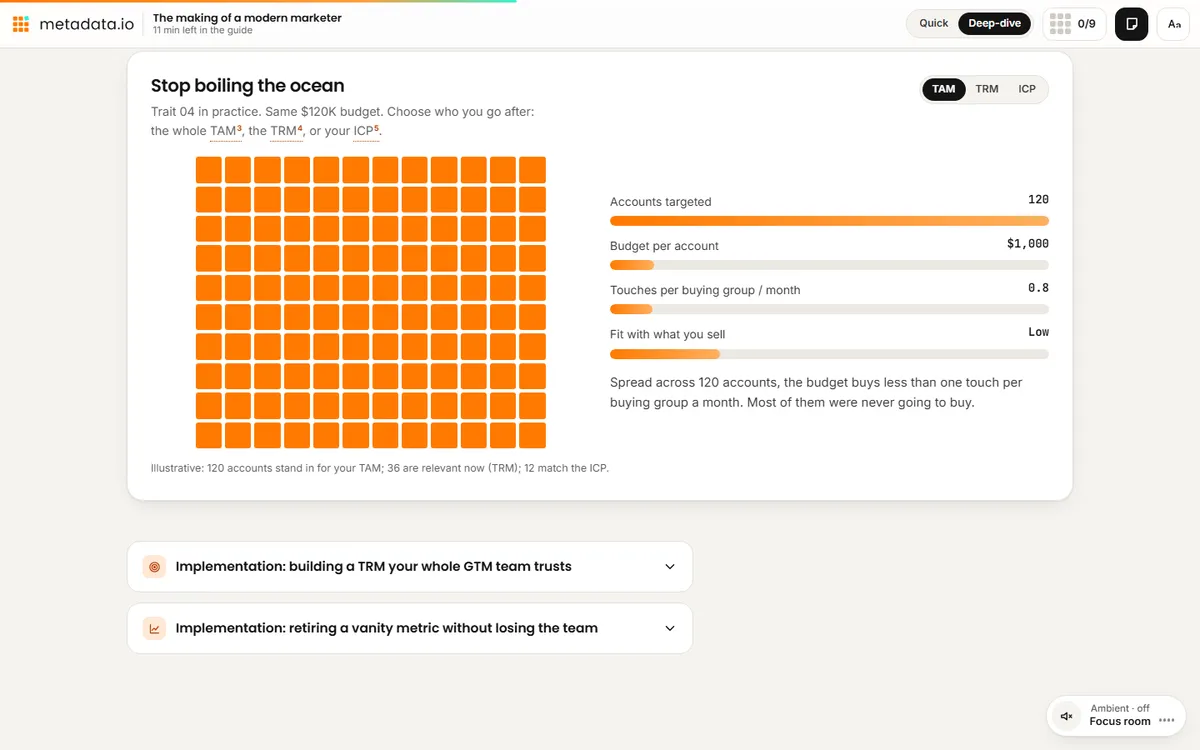
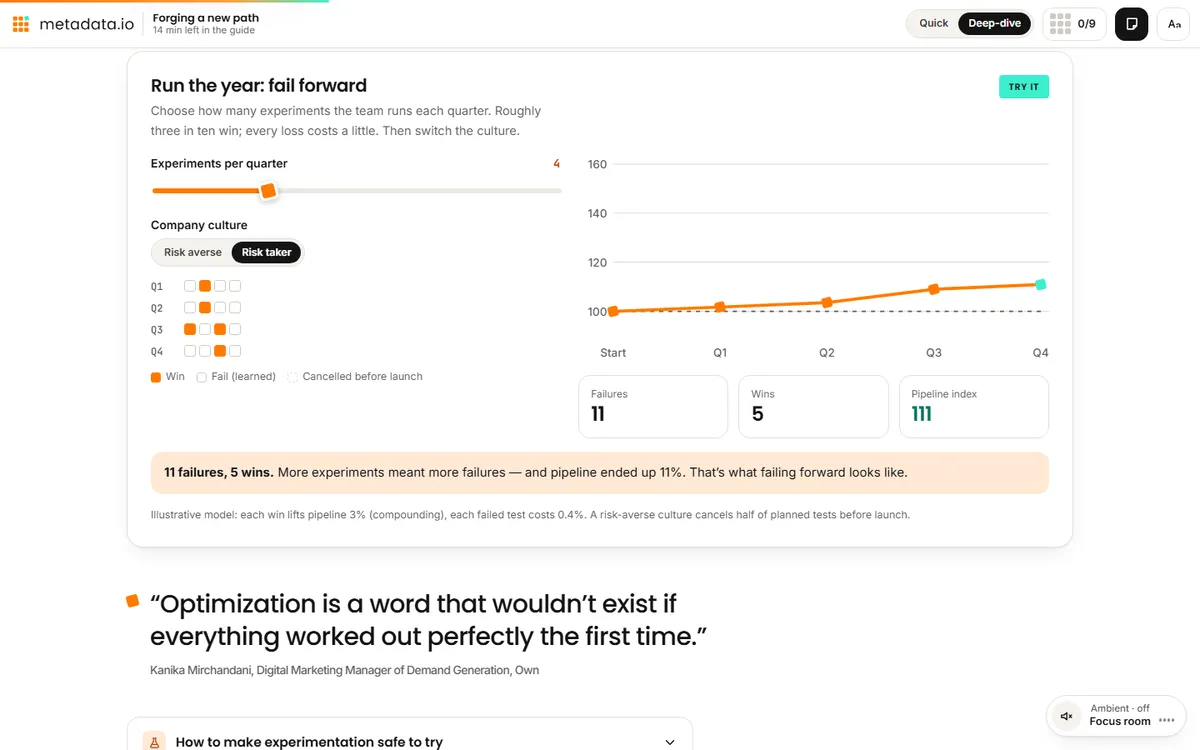
Experiments per quarter, company culture, targeting scope and budget per account all move real numbers in illustrative models.
Made the assessment live
The printed maturity table became ten scales the reader sets, with a summary of where they stand.
Organized the voices
Twelve practitioner quotes can be filtered by experimentation, data and revenue, alignment, technology and strategic role.
Showed the method
A closing table explains, section by section, which page each pattern comes from and why it was chosen.
Key interactives
Each habit in the guide has a model to run, and the assessment pulls them together.
| Interactive | Type | What the reader does |
|---|---|---|
| One pipeline, many stories | Micro-loop | Switches how credit is counted and watches what reaches the leadership team |
| Run the year | Simulator | Sets experiments per quarter and culture, then sees wins, failures and pipeline |
| Same quarter, two dashboards | Toggle | Switches from vanity metrics to the numbers the board tracks |
| Stop boiling the ocean | Model | Targets the TAM, TRM or ICP with the same budget and compares reach |
| Data-driven companies are… | Unit chart | Picks an outcome to see how much more likely data-driven companies are to achieve it |
| Maturity assessment | Assessment | Rates their organization on ten scales |
| Modern marketers | Filterable quotes | Browses twelve practitioner voices by theme |
| Five questions, one minute | Quiz | Checks the guide’s main ideas |
Reading experience and accessibility
Eleven print pages become one responsive guide with room for the ideas to be tried.
Two tracks
Quick keeps the core text, key interactives and the assessment; Deep adds deep-dive notes and long-form commentary.
Listen along
A read-aloud introduction using the reader’s device voice.
Reading settings
Text size, Auto, Light, Dark and Sepia themes, dyslexia-friendly type (Atkinson Hyperlegible) and bionic emphasis. Field notes can be shown beside the text.
Announced results
Eight live regions announce simulator and assessment results.
Footnoted terms
Terms such as TAM, TRM, ICP, NRR and vanity metrics are footnoted where they first appear.
A print stylesheet for the full guide and the reader’s assessment.
Design system
The guide’s orange squares and dark pages carry through, with the cover mark assembling square by square.
- Orange
#FF7A00Logo squares, fills and primary actions - Ink
#141414Text and night bands - Mint
#3CEFCFThe tilted square, completion and correct answers - Orange ink
#B93F0BLinks and labels on paper - Paper
#F5F3EFReading background
Type
Poppins for display, Inter for reading, JetBrains Mono for figures, and Atkinson Hyperlegible for the dyslexia-friendly mode.
Squares as a system
The orange square from the guide’s cover becomes the unit of every chart, from targeted accounts to likelihood.
Method in the open
A closing table maps every section to its source page and interaction pattern.
How it’s built
A short guide with many models: each simulator is a small, separate block that can be retuned without touching the text.
| Aspect | Approach |
|---|---|
| Delivery | One self-contained HTML file (about 290 KB) with its images embedded. No platform, plugin or reader app. |
| External requests | The web fonts, with system-font fallbacks, and a page-view analytics tag |
| Narration | The reader’s device voice through the Web Speech API, with word or sentence tracking |
| State | Answers, progress and settings saved in the reader’s browser |
PDF vs interactive edition
The PDF makes the argument. The edition lets the reader test it.
| Question | Original PDF | Interactive edition |
|---|---|---|
| Does failing forward pay? | A claim | A year of experiments to run |
| What should we report to the board? | A description | A switch between two dashboards |
| How focused should targeting be? | Definitions of TAM, TRM and ICP | Same budget, three scopes, compared |
| How mature are we? | A static table | Ten scales, a scored profile and focus-first actions |
| Who agrees? | Quotes at the back | Twelve voices, filterable by theme |
What we would measure
This edition is an independent demonstration with no audience data, and we don’t report results for it. For a marketing platform, the assessment describes each reader’s organization.
Maturity profile
Where readers place themselves on each of the ten scales.
Points of view
Which simulators readers use most and which settings they choose.
Intent
Assessments completed and clicks to the publisher’s site.
Where this approach fits
Thought leadership earns attention when readers can try the ideas.
Opinion-led guides
Arguments that become small models the reader can run.
Maturity models
Printed tables that become live assessments.
Practitioner roundups
Quotes that can be browsed by theme.
FAQ
Common questions about this edition and projects like it.
Was this edition commissioned by Metadata.io or GTM Partners?
No. It is an independent portfolio demonstration built from a guide Metadata.io or GTM Partners published. The guide is GTM Partners’ and Metadata.io’s; the editorial layer, interactions, design and build are Studio Vektor’s.
Are the simulator numbers real?
No. The simulators are illustrative models that show the guide’s argument; the figures the guide cites, such as the McKinsey data, are labelled with their source.
What would an edition like this cost?
Interactive eBooks start from $635, and the Advanced package with one defined quiz or scoring tool and interactive charts starts from $1,170. An edition at this depth, with several simulators, a ten-scale assessment and filterable quotes, goes beyond those packages and is quoted on scope after we see your document.
Can the assessment be updated?
Yes. The scales and their descriptions are data in the page, so they can be edited or extended without rebuilding the edition.
Publishing thought leadership?
Let readers test your argument.
Opinion-led guides, frameworks and maturity models work well. Send the PDF and we’ll show you how.