

- Studio Vektor
- Interactive eBooks
- NiCE: Harnessing Digital Channels and WFM
Case study · Interactive guide
Harnessing Digital Channels and WFM, from slides to simulators
Contact-center guides talk about gaps between what customers expect and what businesses deliver. The interactive edition of NiCE’s guide lets readers see the gap in the data, run the same question through two bots and watch digital work land in the wrong staffing interval.

- Publisher
- NiCE
- Original format
- 14-page landscape PDF eBook
- Edition
- 7 short chapters, simulators, a quiz
- Status
- Independent portfolio demonstration
An interactive edition of an eBook NiCE published. The guide’s text and cited statistics are as published; the gists, demos, simulators and quiz were written for this edition by Studio Vektor. Not commissioned by, affiliated with or endorsed by NiCE. Conversations and staffing data in the simulators are illustrative.

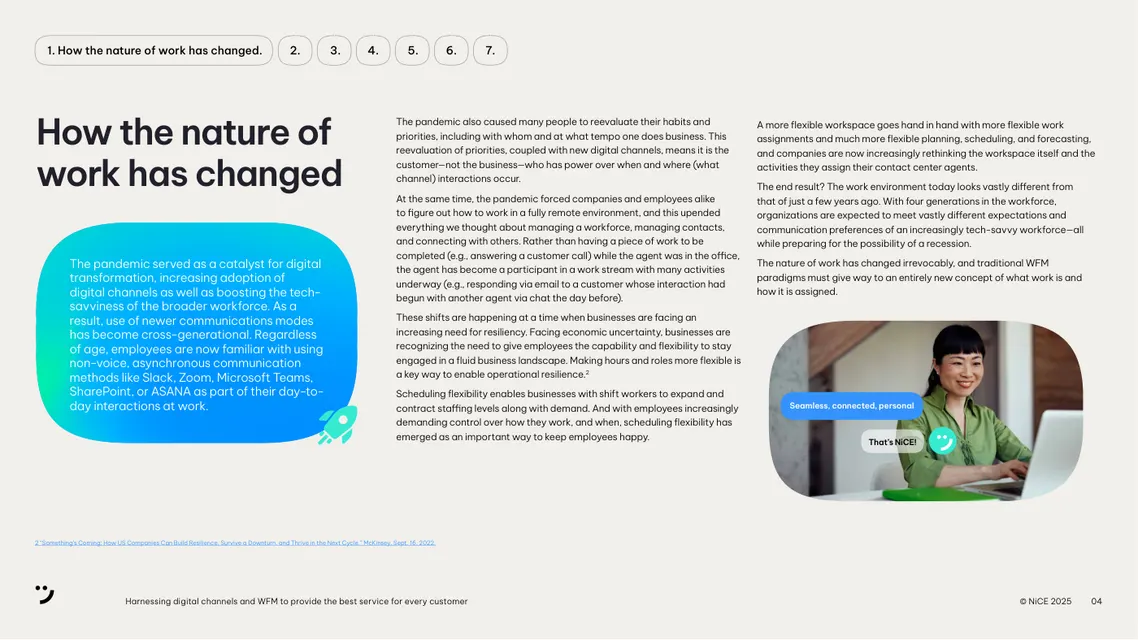
The starting point: a landscape eBook
NiCE’s guide explains how the shift to digital channels has opened a divide between what customers expect and what contact centers deliver, and how smart self-service, collaborative AI, knowledge and digital workforce management (WFM) close it. In print it is 14 widescreen pages of statistics and short sections. The staffing problem at its heart, that digital work doesn’t arrive when a call would, is hard to picture from a page.
The brief
Contact-center leaders know the theory. The edition had to show the mechanics.
Make the gap visible
Turn the survey’s customer and business answers into one chart that can show either side or the gap between them.
Compare, side by side
Run the same customer question through a scripted bot and smart self-service to show what the guide’s four rules change.
Simulate the staffing problem
Show why digital conversations counted at the end of a contact misstate the workload in each interval.
Who it is for
Contact-center, customer-experience and workforce-management leaders.
CX leaders
See where customer expectations and business plans diverge most.
WFM teams
Use the interval simulator to explain why digital work needs its own forecasting.
Self-service owners
Compare a narrative bot with smart self-service on the same question.
From PDF to edition, chapter by chapter
The edition keeps the guide’s seven chapters in order.
| Chapter | The guide’s point | In the interactive edition |
|---|---|---|
| Introduction | The nature of work has changed | A read-aloud introduction and a choice of Quick or Deep track |
| 1 · How work has changed | Digital channels and a more tech-savvy workforce | The chapter’s argument with a 30-second gist on the Quick track |
| 2 · Bridging the CX divide | Customers expect more than businesses plan to deliver | A gap chart of customer and business answers, and what 100 customers experienced |
| 3 · Smart self-service | Four rules for self-service that delivers | A demo that lights each rule, and the same question run through two bots |
| 4 · Collaborative AI | AI improves routing, self-service and agent satisfaction | Count-up statistics and three ways AI makes self-service smarter |
| 5 · Knowledge | Knowledge powers the AI-driven CX machine | One approved answer published to web search, a chatbot and the agent desktop in six languages |
| 6 · Requirements of the digital contact center | Digital work needs its own forecasting and scheduling | An interval simulator for six digital conversations, and a checkpoint quiz |
| 7 · Better together | A combined digital WFM and CX platform | The closing argument and next steps |
What Studio Vektor did
Turned the guide’s arguments into small, concrete demonstrations.
Charted the divide
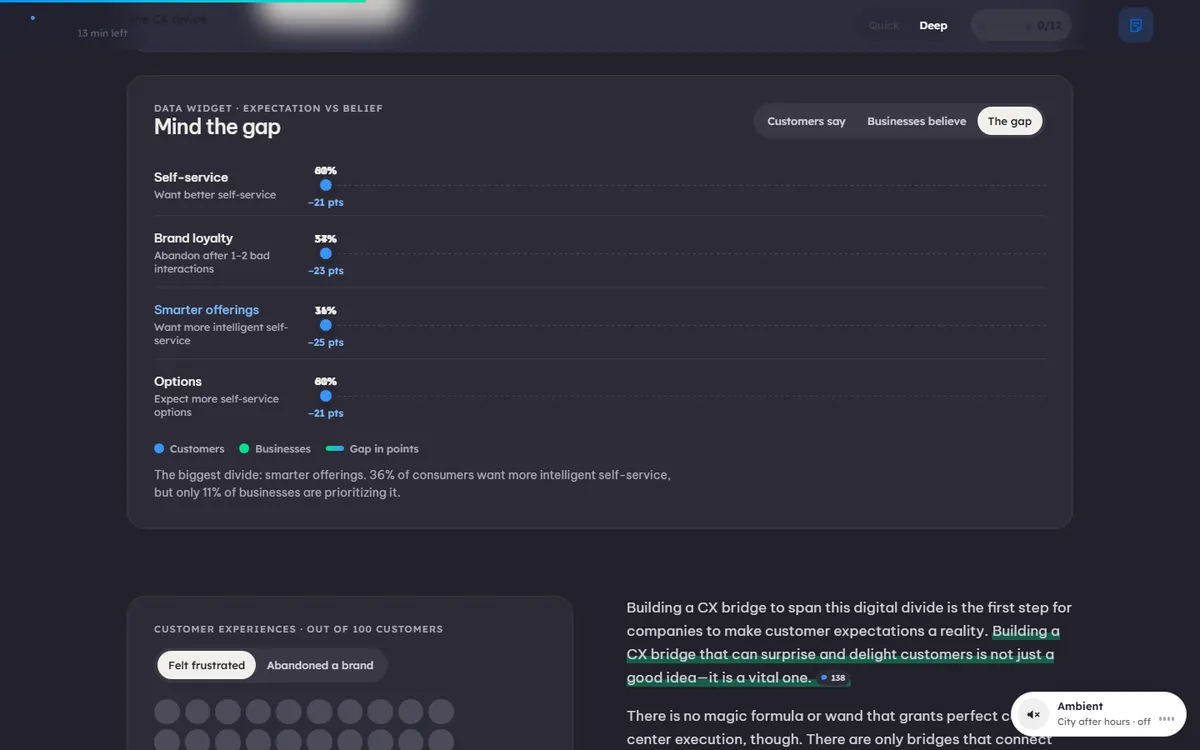
One chart switches between what customers say, what businesses believe and the gap between them, with the biggest divide called out.
Ran two bots
A scripted help-center bot and smart self-service answer the same question, counting turns, repetitions and the outcome.
Simulated the intervals
Six social, email and chat conversations are counted either when the contact ends or true to interval, at 15 or 30 minutes, to show how much work is misplaced.
Built a bridge
The guide’s CX-bridge metaphor becomes the edition’s progress: each chapter and the quiz add a plank.
Key interactives
Every chart, demo and simulator stays in both reading tracks.

| Interactive | Type | What the reader does |
|---|---|---|
| Mind the gap | Data widget | Switches between customer answers, business answers and the gap |
| Out of 100 customers | Unit chart | Sees how many felt frustrated or abandoned a brand |
| Smart self-service rules | Demo | Runs the demo and watches each of the four rules light up |
| Same question, two bots | Side-by-side demo | Runs one conversation through a narrative bot and smart self-service |
| Collaborative AI | Explainer | Steps through smarter routing and the other ways AI improves self-service |
| One answer, every channel | Demo | Switches one knowledge article between web search, chatbot and agent desktop, and between six languages |
| When does the work happen? | Simulator | Changes how digital work is counted and the interval length to see the staffing error |
| Lock in what you’ve read | Quiz | Answers five questions with instant feedback and a recap |
Reading experience and accessibility
Fourteen widescreen pages become one responsive guide with a short reading time.
Two tracks
Quick keeps the key ideas and every chart, demo and simulator; Deep adds the guide’s supporting argument.
Listen along
A read-aloud introduction using the reader’s device voice.
Reading settings
Text size, Auto, Light, Dark and Sepia themes, dyslexia-friendly type (Atkinson Hyperlegible) and bionic emphasis.
Announced results
Fifteen live regions announce simulator and quiz results.
Ambient sound
An optional, muted-by-default soundscape for focused reading.
A print stylesheet for the full guide.
Design system
NiCE’s blue and green on a dark night palette, with warm paper for reading.
- NiCE blue
#3894FCActions and selections - Green
#00E28APositive results and the brand gradient - Cyan
#00C8E6Brand gradient and highlights - Night
#22212BText and dark sections - Paper
#F2F0EBReading background
Type
Lexend for display and interface, Be Vietnam Pro for reading, and Atkinson Hyperlegible for the dyslexia-friendly mode.
One metaphor
The guide’s CX bridge is the thread through the design, from chapter openers to the progress bar.
Illustrative data, labelled
Simulators state that their conversations and timings are illustrative.
How it’s built
Short chapters and self-contained demos make the edition easy to update as products change.
| Aspect | Approach |
|---|---|
| Delivery | One self-contained HTML file (about 810 KB) with its images embedded. No platform, plugin or reader app. |
| External requests | The web fonts, with system-font fallbacks, and a page-view analytics tag |
| Narration | The reader’s device voice through the Web Speech API, with word or sentence tracking |
| State | Answers, progress and settings saved in the reader’s browser |
PDF vs interactive edition
The PDF states the problem. The edition shows it happening.
| Question | Original PDF | Interactive edition |
|---|---|---|
| Where is the biggest gap? | Two sets of percentages | One chart with the gap called out |
| What does smart self-service change? | Four rules in a list | Two bots answering the same question |
| Why does digital work break forecasts? | A paragraph | A simulator of six conversations |
| Did I take it in? | No check | A five-question quiz with a recap |
What we would measure
This edition is an independent demonstration with no audience data, and we don’t report results for it. For a CX platform vendor, readers’ choices show which problem they are trying to solve.
Topics
Which simulators and demos readers use most.
Staffing interest
Readers who change interval settings are likely to own forecasting.
Intent
Quiz completion and clicks to the vendor’s site.
Where this approach fits
Operational guides benefit from showing the mechanics.
Contact-center guides
Simulators for staffing, routing and handle time.
Product comparisons
Side-by-side demos of the old way and the new way.
Survey-backed eBooks
Charts that show both sides of a gap.
FAQ
Common questions about this edition and projects like it.
Was this edition commissioned by NiCE?
No. It is an independent portfolio demonstration built from an eBook NiCE published. The guide is NiCE’s; the editorial layer, interactions, design and build are Studio Vektor’s.
Is the simulator data real?
No. The conversations and timings are illustrative and labelled as such; statistics from the guide are shown as published.
What would an edition like this cost?
Interactive eBooks start from $635, and the Advanced package with one defined quiz or scoring tool and interactive charts starts from $1,170. An edition at this depth, with simulators, side-by-side demos and a quiz, goes beyond those packages and is quoted on scope after we see your document.
Can the simulators use our own numbers?
Yes. In a commissioned edition, simulators can be set up with your own volumes, intervals and handle times.
Publishing an operational guide?
Show readers the mechanics, not just the message.
Contact-center, operations and product guides work well. Send the PDF and we’ll show you how.