

- Studio Vektor
- Interactive eBooks
- Superhuman: The Ultimate Guide to Designing for AI ROI
Case study · Interactive guide
Designing for AI ROI, from guide to stack audit
Superhuman’s guide argues that AI gains leak away in the seams between tools. The interactive edition lets readers calculate their own productivity tax, audit their AI stack and export the result, while the tax shrinks as they read.
- Publisher
- Superhuman (formerly Grammarly)
- Original format
- 11-page PDF guide
- Edition
- 5 chapters, a calculator, an exportable audit
- Status
- Independent portfolio demonstration
An interactive edition of a guide Superhuman published. The guide’s text and research figures are as published; the editor’s notes, calculator, audit template and quiz were written for this edition by Studio Vektor. Not commissioned by, affiliated with or endorsed by Superhuman. The calculator and sample audit rows are illustrative.

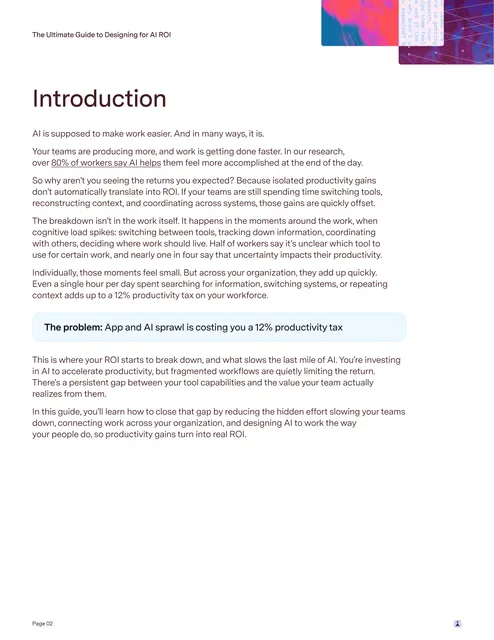
The starting point: a short argument for IT leaders
The guide explains why AI productivity gains don’t automatically become returns: switching between tools, tracking down information and repeating context add up to a 12% productivity tax. It describes what high-ROI environments do differently and how to evaluate AI platforms. In print it is 11 pages, and its audit template and checklist have to be copied out by hand.
The brief
The guide’s audience is IT and business leaders deciding what to buy. The edition had to turn the argument into numbers and a working audit.
Put a number on the tax
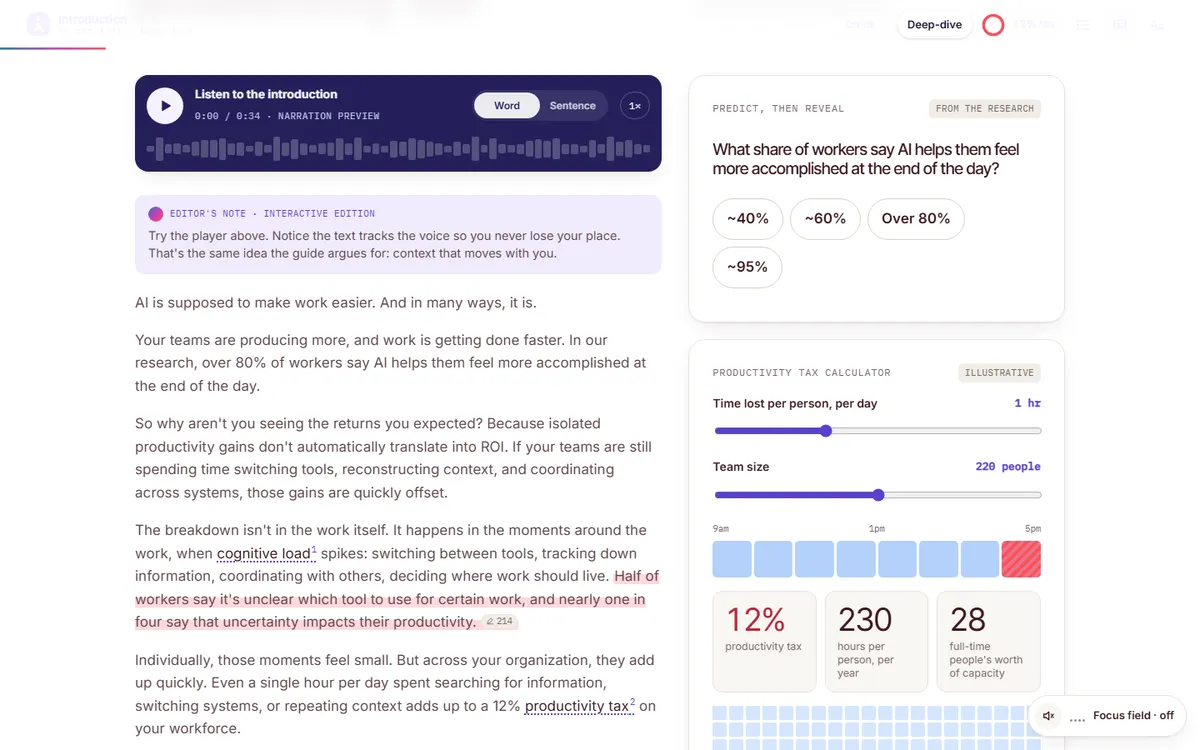
Let readers enter time lost and team size to see the productivity tax in hours and people.
Make the audit usable
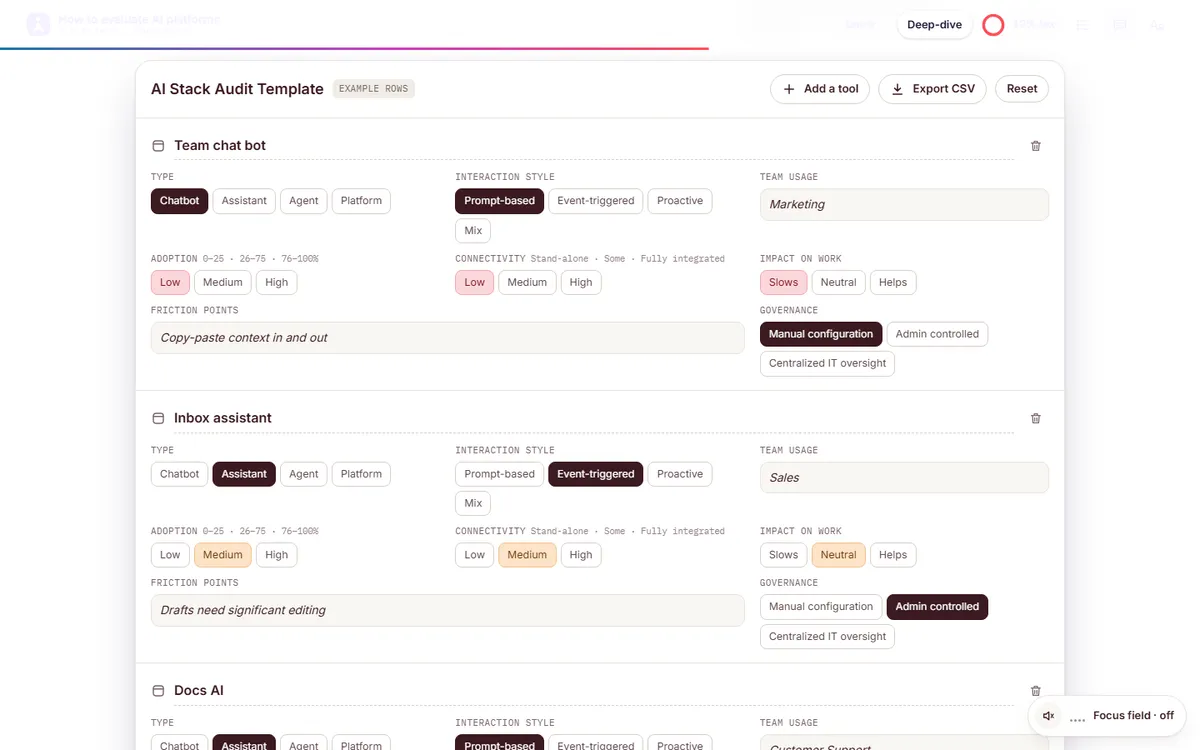
Turn the printed audit template into rows the reader can add, edit and export.
Reward reading
Show the 12% tax shrinking as each chapter is read and the quiz is finished.
Who it is for
IT leaders, operations leaders and the executives who sign off AI spending.
IT leaders
Audit the current AI stack and export it for the next planning meeting.
Operations leaders
Calculate what context switching costs their teams.
Executives
Read the Quick track’s key stats, the four characteristics and the audit.
From PDF to edition, chapter by chapter
Each chapter shows the page it comes from in the guide.
| Chapter | The guide’s point | In the interactive edition |
|---|---|---|
| Introduction (p. 02) | The 12% productivity tax | A read-aloud introduction with word or sentence tracking, a predict-then-reveal question and the productivity-tax calculator |
| 1 · Why tools alone don’t deliver ROI (p. 03) | The cost is in the seams between tools | A micro-loop of one request’s journey through fragmented and connected tools |
| 2 · Designing for AI ROI (pp. 04–06) | Lower cognitive load, fewer decisions, context that carries | The four characteristics of high-ROI environments and the AI stack audit template |
| 3 · Evaluating AI platforms (pp. 07–09) | Ask how a platform changes the way work happens | The questions to ask, compared with point-solution questions, and a link to Superhuman’s platform checklist |
| 4 · How platforms multiply AI ROI (p. 10) | A platform makes each tool worth more | The closing argument |
| Lock in what you read | — | A five-question quiz with explanations and a shareable recap |
What Studio Vektor did
Made the guide’s central number personal and its template usable.
Built the calculator
Time lost per person per day and team size produce the tax, hours lost a year and the equivalent number of full-time people.
Made the audit real
The AI stack audit lists each tool’s type, interaction style, adoption, connectivity, friction points, team usage, impact and governance, and exports as CSV.
Asked first
Readers guess what share of workers say AI helps them feel more accomplished before the answer appears.
Turned reading into progress
The header’s 12% tax shrinks as chapters are read, closing the guide’s twelve seams.
Key interactives
Both tracks keep every interactive. Each chapter has something to try.
| Interactive | Type | What the reader does |
|---|---|---|
| What share of workers…? | Predict, then reveal | Guesses the share of workers who say AI helps them feel accomplished |
| Productivity tax | Calculator | Sets time lost and team size to see hours and people lost a year |
| A request’s journey | Micro-loop | Compares one request in fragmented and connected tools, counting tool switches and context rebuilds |
| AI stack audit | Template | Adds and rates tools, then exports the audit as CSV |
| Ask the right questions | Explainer | Compares point-solution questions with platform questions |
| Lock in what you read | Quiz | Answers five questions and shares a recap |
Reading experience and accessibility
An eleven-page guide becomes one responsive edition that can be heard as well as read.
Two tracks
Quick trims long passages to their gist; Deep-dive keeps every word of the guide.
Listen along
Narration of the introduction with word or sentence tracking, using the reader’s device voice.
Reading settings
Text size, Auto, Light, Dark and Sepia themes, dyslexia-friendly type (Atkinson Hyperlegible) and bionic emphasis.
Announced results
Nine live regions announce calculator and quiz results.
Progress that means something
The productivity tax in the header falls as the reader works through the guide.
Export and print
The audit exports as CSV, and a print stylesheet covers the guide.
Design system
A deep indigo ground with violet, coral and teal, echoing the guide’s glitch-art cover.
- Indigo
#24205ACover and dark grounds - Violet
#AE9BFFActions and highlights - Coral
#FF6B74The productivity tax and friction - Teal
#5DB7E6Data and secondary accents - Green
#5FD39AGains and correct answers
Type
Inter Tight for display, Inter for reading, IBM Plex Mono for figures, and Atkinson Hyperlegible for the dyslexia-friendly mode.
The tax as a motif
The 12% figure appears in the header from the start and shrinks with the reader’s progress.
Illustrative, labelled
Calculator results and sample audit rows are labelled as illustrative.
How it’s built
The audit and calculator are data-driven, so their fields can be changed without touching the design.
| Aspect | Approach |
|---|---|
| Delivery | One self-contained HTML file (about 355 KB) with its images embedded. No platform, plugin or reader app. |
| External requests | The web fonts, with system-font fallbacks, and a page-view analytics tag |
| Narration | The reader’s device voice through the Web Speech API, with word or sentence tracking |
| State | Answers, progress and settings saved in the reader’s browser |
| Export | The audit downloads as a CSV file generated in the browser |
PDF vs interactive edition
The PDF makes the case. The edition gives the reader their own numbers and a working template.
| Question | Original PDF | Interactive edition |
|---|---|---|
| What does the tax cost us? | A percentage | Hours and people for our team size |
| What’s in our AI stack? | A template to copy out | An audit to fill in and export |
| Where does the time go? | A description | A loop counting tool switches and context rebuilds |
| Did we get it? | No check | A five-question quiz with a recap |
What we would measure
This edition is an independent demonstration with no audience data, and we don’t report results for it. For a software company, the audit tells you what each reader is running today.
Stack profile
Tool types, adoption and governance across readers’ audits.
Pain size
Team sizes and time lost entered in the calculator.
Intent
Exported audits and clicks to the vendor’s site.
Where this approach fits
Guides that include a template or a formula are ideal.
ROI guides
Calculators built on the guide’s own figures.
Evaluation frameworks
Checklists and audits that export.
IT buyer content
Editions that give the reader something to take to the next meeting.
FAQ
Common questions about this edition and projects like it.
Was this edition commissioned by Superhuman?
No. It is an independent portfolio demonstration built from a guide Superhuman published. The guide is Superhuman’s; the editorial layer, interactions, design and build are Studio Vektor’s.
Where does the 12% come from?
From the guide’s research, as published. The calculator applies it to the reader’s own inputs and labels the result as illustrative.
What would an edition like this cost?
Interactive eBooks start from $635, and the Advanced package with one defined quiz or scoring tool and interactive charts starts from $1,170. An edition at this depth, with a calculator, an exportable audit and narration, goes beyond those packages and is quoted on scope after we see your document.
Can audits be sent to our team?
In this demonstration the audit stays in the browser until the reader exports it. A commissioned edition can send it to a form or your CRM with consent.
Publishing a guide with a template?
Make the template something readers can fill in.
ROI guides, audits and evaluation frameworks work well. Send the PDF and we’ll show you how.